Health Dashboard
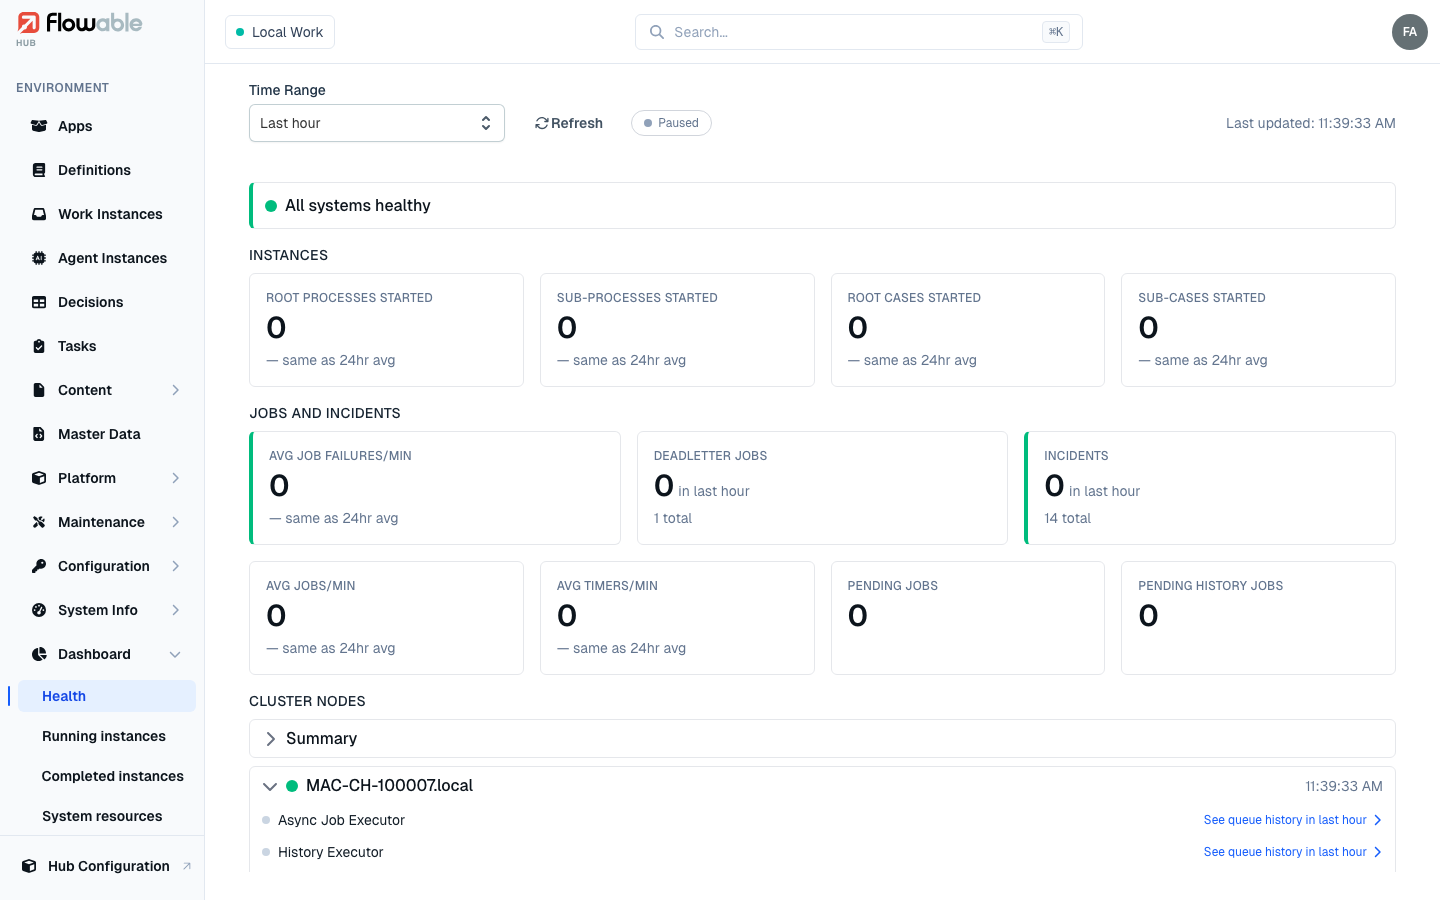
The Health dashboard is the single most important screen for operating a Flowable environment. Where the other dashboards plot one metric over time, Health answers the question every operator asks first — "is everything alright right now, and if not, where do I look?" — by combining a live system-status verdict, recent throughput, job and incident pressure, and per-node cluster health on one page.
Open it from Dashboard → Health in the sidebar. It is the recommended starting point at the beginning of a shift or whenever you are investigating a problem.
Time range and refreshing
At the top, the Time Range selector (Last 10 minutes, Last hour, or Last 24 hours) controls the window the figures are measured over. Each figure is also compared against a longer reference window, so you can tell a normal level from a deviation at a glance.
Health refreshes itself live. The Paused / Refresh control lets you pause automatic refreshing (useful while you read a snapshot) and force a manual refresh, and Last updated shows when the figures were last pulled.
System status banner
The banner directly under the controls is the headline verdict. A green All systems healthy means every monitored signal is within normal bounds. If a signal crosses a threshold — for example a spike in job failures or a growing deadletter queue — the banner changes colour and message to draw your attention, and the relevant card below is highlighted with a coloured edge.
Instances
The Instances row shows how much work has started in the selected window, split four ways:
- Root Processes Started — top-level BPMN process instances.
- Sub-Processes Started — process instances started as children of another instance.
- Root Cases Started — top-level CMMN case instances.
- Sub-Cases Started — case instances started as children of another instance.
Each card compares the current figure against a longer reference window, so a reading in line with the reference is normal while a more or less reading flags a deviation worth understanding — a sudden drop in started instances can be as significant as a spike.
Jobs and incidents
This section is where most operational problems first show up:
- Avg Job Failures/min — the rate at which jobs are failing. Sustained failures are the earliest sign of a systemic problem (a broken integration, a bad deployment).
- Deadletter Jobs — jobs that have exhausted their retries and need manual intervention. Shown both for the last hour and as a running total; any non-zero total deserves a look in Jobs.
- Incidents — execution problems, again for the last hour and in total. Drill into them on the Incidents page.
- Avg Jobs/min and Avg Timers/min — throughput of regular jobs and timers, with the reference-window comparison.
- Pending Jobs and Pending History Jobs — work waiting to be picked up. A steadily rising pending count means the async executors are not keeping up with the incoming load.
Cards that need attention are highlighted, so you can scan this block in a second and know whether to dig into jobs or incidents.
Cluster nodes
The Cluster Nodes section reports the health of the engine cluster itself — essential when running self-hosted Flowable across multiple nodes.
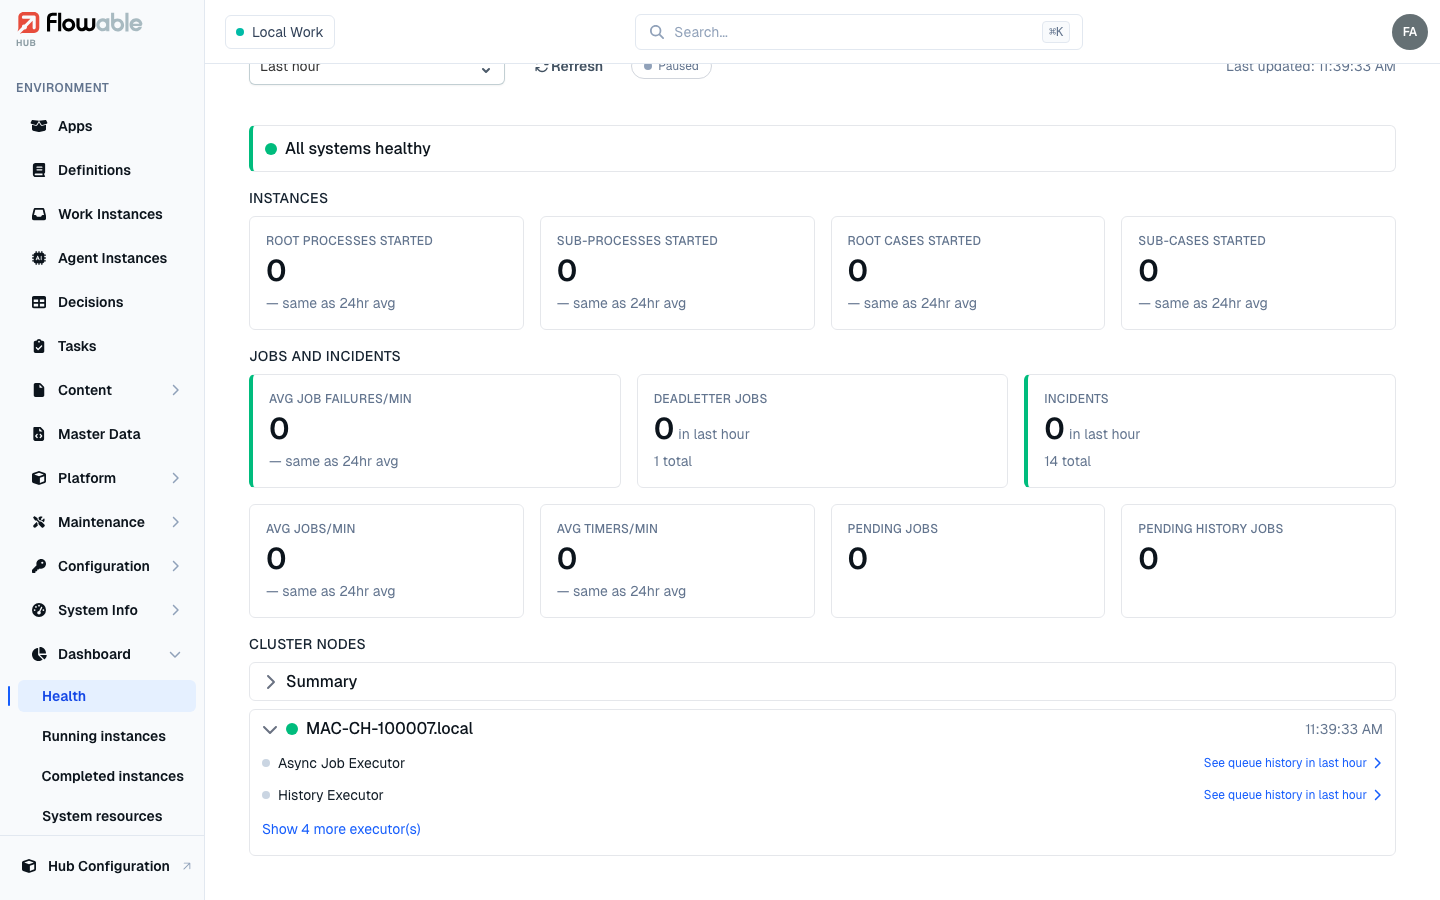
- Summary gives an aggregate view across all nodes; expand it for the combined picture.
- Each node (identified by its host name, with a status dot and last-seen timestamp) lists its executors — the Async Job Executor and History Executor, plus any others behind Show more executor(s). A healthy node reports its executors as running.
- See queue history in last hour expands the recent queue activity for that executor — the average and peak queue usage over the window — so you can confirm work is flowing and spot a node that has fallen behind or stopped consuming.
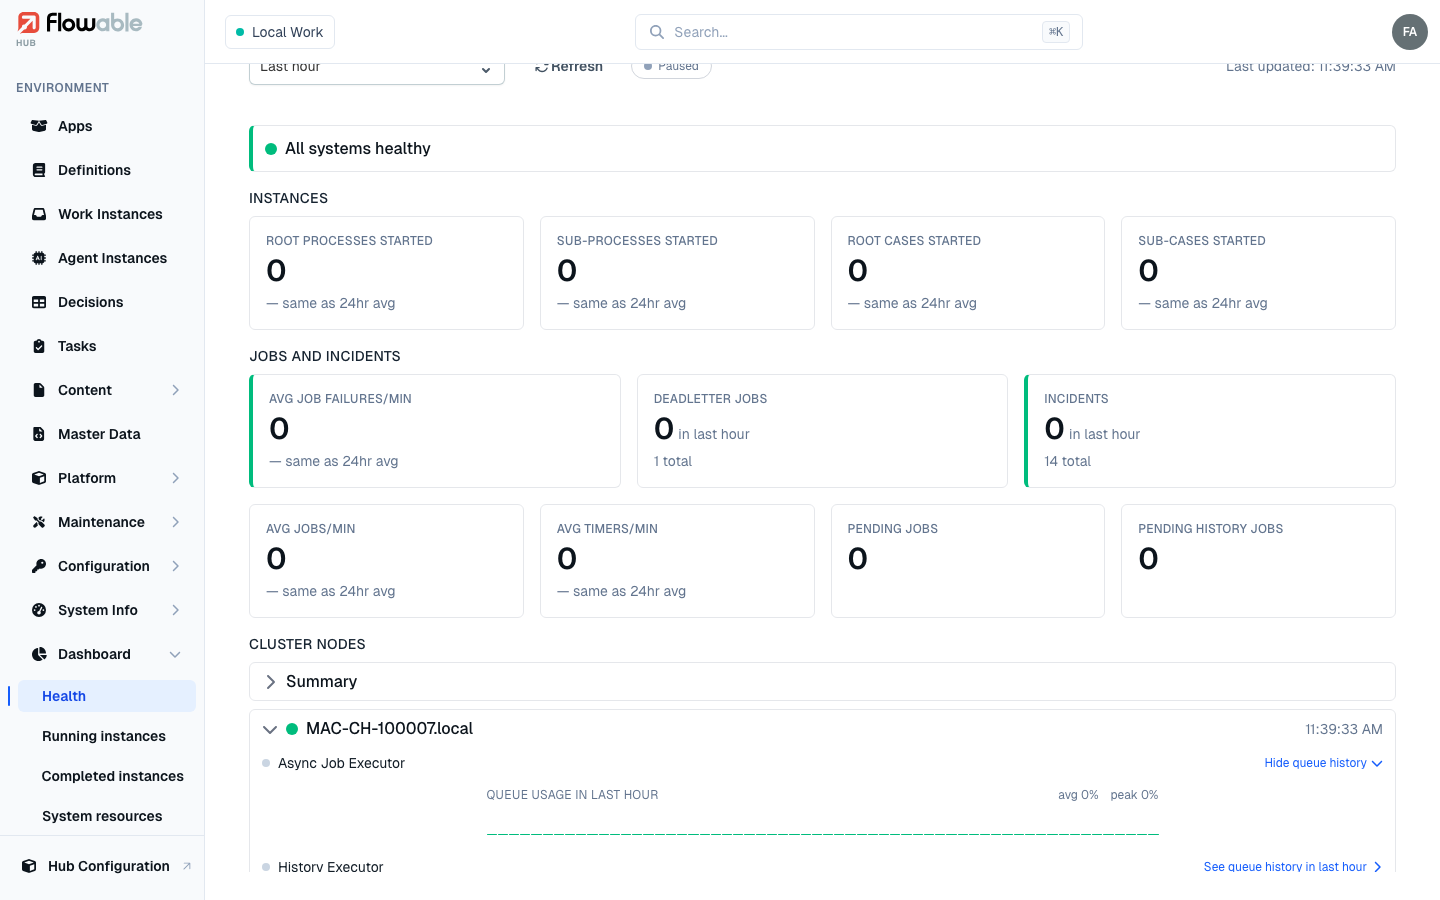
Together these signals let you distinguish an application-level problem (failing jobs, incidents) from an infrastructure-level one (a node down, an executor not consuming) without leaving the page.