Dashboards
Beyond the Health dashboard — which is the live, at-a-glance status board and deserves its own dedicated page — the Dashboard section offers a set of time-series dashboards that plot a single aspect of the environment over a period you choose.
How the time-series dashboards work
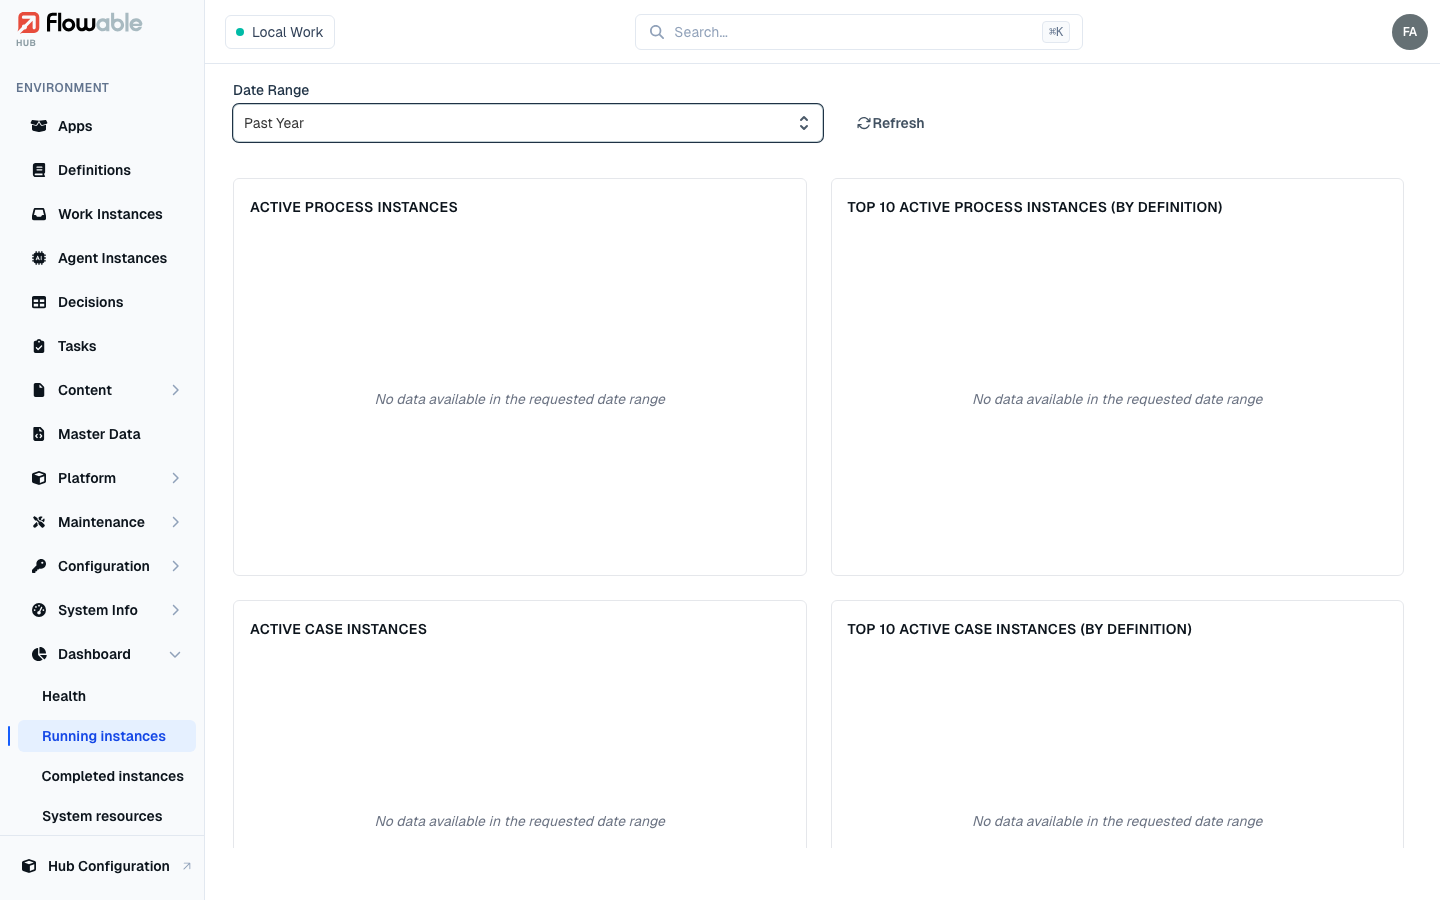
Each of these dashboards presents one or more charts over a selectable date range (Past Hour, Day, Week, Month, Year, or a custom range). Choosing Custom opens a date picker for an exact window, and a Refresh button re-runs the charts against the current time. They draw on collected metrics, so the charts are populated when metrics collection is enabled for the environment and there is activity within the selected range; on a quiet environment, or a window with no activity, a chart shows "No data available in the requested date range." In a multi-tenant environment you can scope a dashboard to a single tenant.
Available dashboards
- Running instances — active process and case instances over time, plus the top definitions by active count.
- Completed instances — completion metrics for processes and cases.
- System resources — average CPU and memory usage across the cluster nodes.
- Engine operations — the volume of engine operations over time.
- Async Executors — activity of the async job executors.
- Job Execution / Job Failures — throughput and failure rates for asynchronous jobs.
- Event Registry — event activity flowing through the event registry.
- Service Registry — executions involving external services, useful for tracking integration health.
- REST Requests — inbound REST request volume.
- Agents — activity of the AI agents running in the environment.
- Agent cost — cost attributed to agent activity, based on the configured Agent Model Prices.
- Indexing — the state and throughput of search indexing.
- Active Users — an overview of active users in the environment.
Agent and cost dashboards
The Agents dashboard focuses on AI agent activity. It leads with KPI cards — invocations, instances completed, total tokens, tool calls, guardrail violations and average duration — and charts breaking usage down over time, by model and by token type, alongside guardrail and evaluator pass rates. A per-agent breakdown table lets you click through to a drill-down for a single agent definition (by version, by operation, and its evaluator quality over time).
The Agent cost dashboard turns that usage into money, using the configured Agent Model Prices: estimated total, input, output and cached cost, cost over time, and a breakdown by model. Models that have recorded usage but no configured price are called out so you can price them.
The exact set of dashboards available depends on how the environment is deployed and which metrics backend (for example a database or Elasticsearch) is configured. For live operational status that does not depend on a metrics window, use the Health dashboard.