
Flowable Control User Guide

Introduction

With Flowable Control you can gain total visibility and total control of your Flowable Engines.

You can quickly find failing processes and get them working again, or modify some aspect of a case to correct wrong data. All the details of the runtime engines are available.

Probe the Finest Details of a Case or Process

Quickly drill down from deployed definitions, through process and case instances down to variable values and assignments. Apply rich filters to find the items you want, including date ranges, variable values, and business keys.

020 general information1

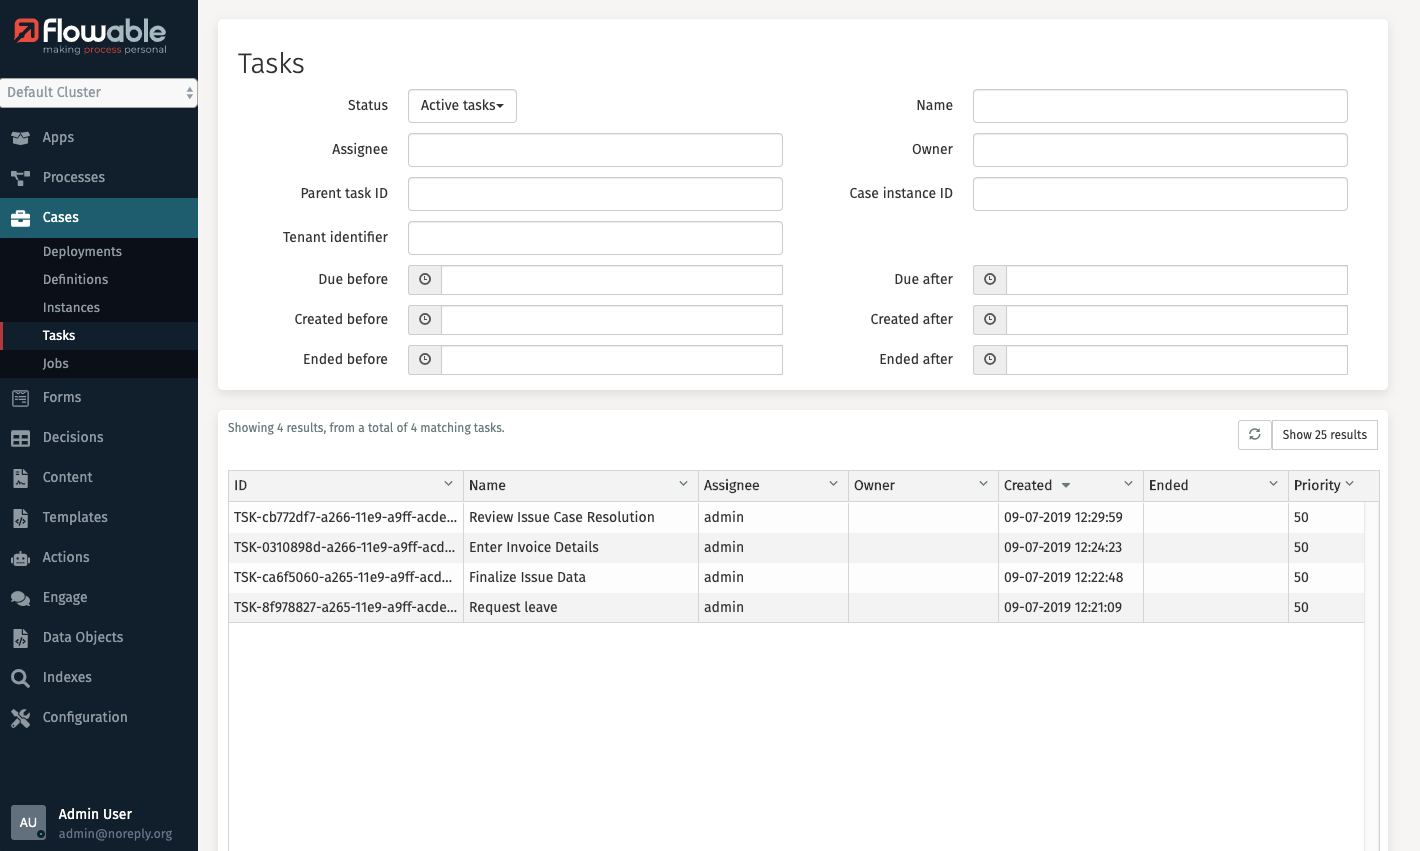
Easy Filters to Find What You Need Quickly

Looking for a particular task started from a case or process? A combination of easy to use filters allows you to zoom in on the item you are looking for, based on date ranges and other significant values.

020 general information2

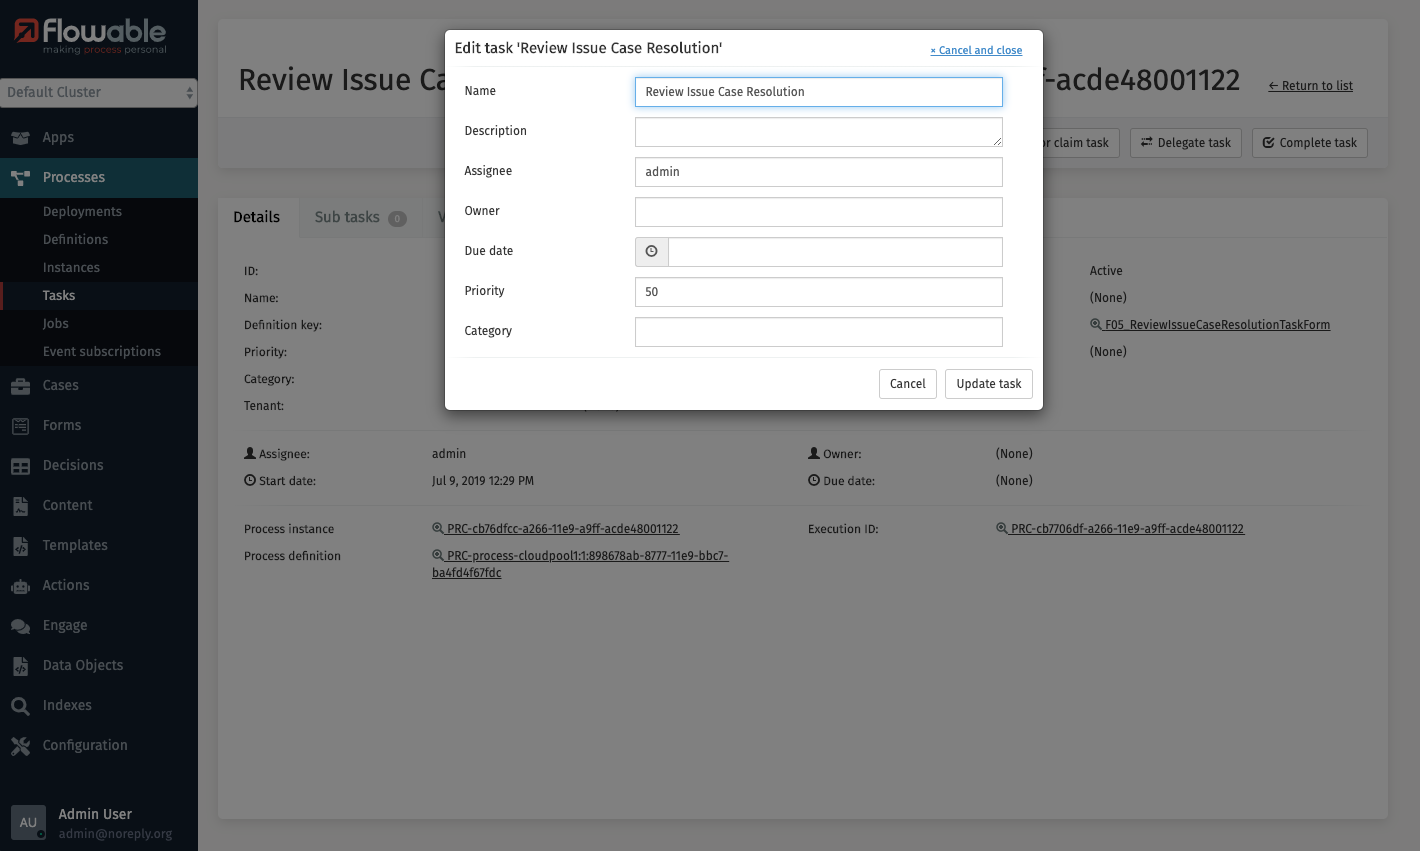
Keep Your Business Flowing

Reassign a stuck task to someone else or complete it as an administrator, it is as simple as filtering for open tasks assigned to a particular person and changing it. Keep your business moving when the unexpected happens.

020 general information3

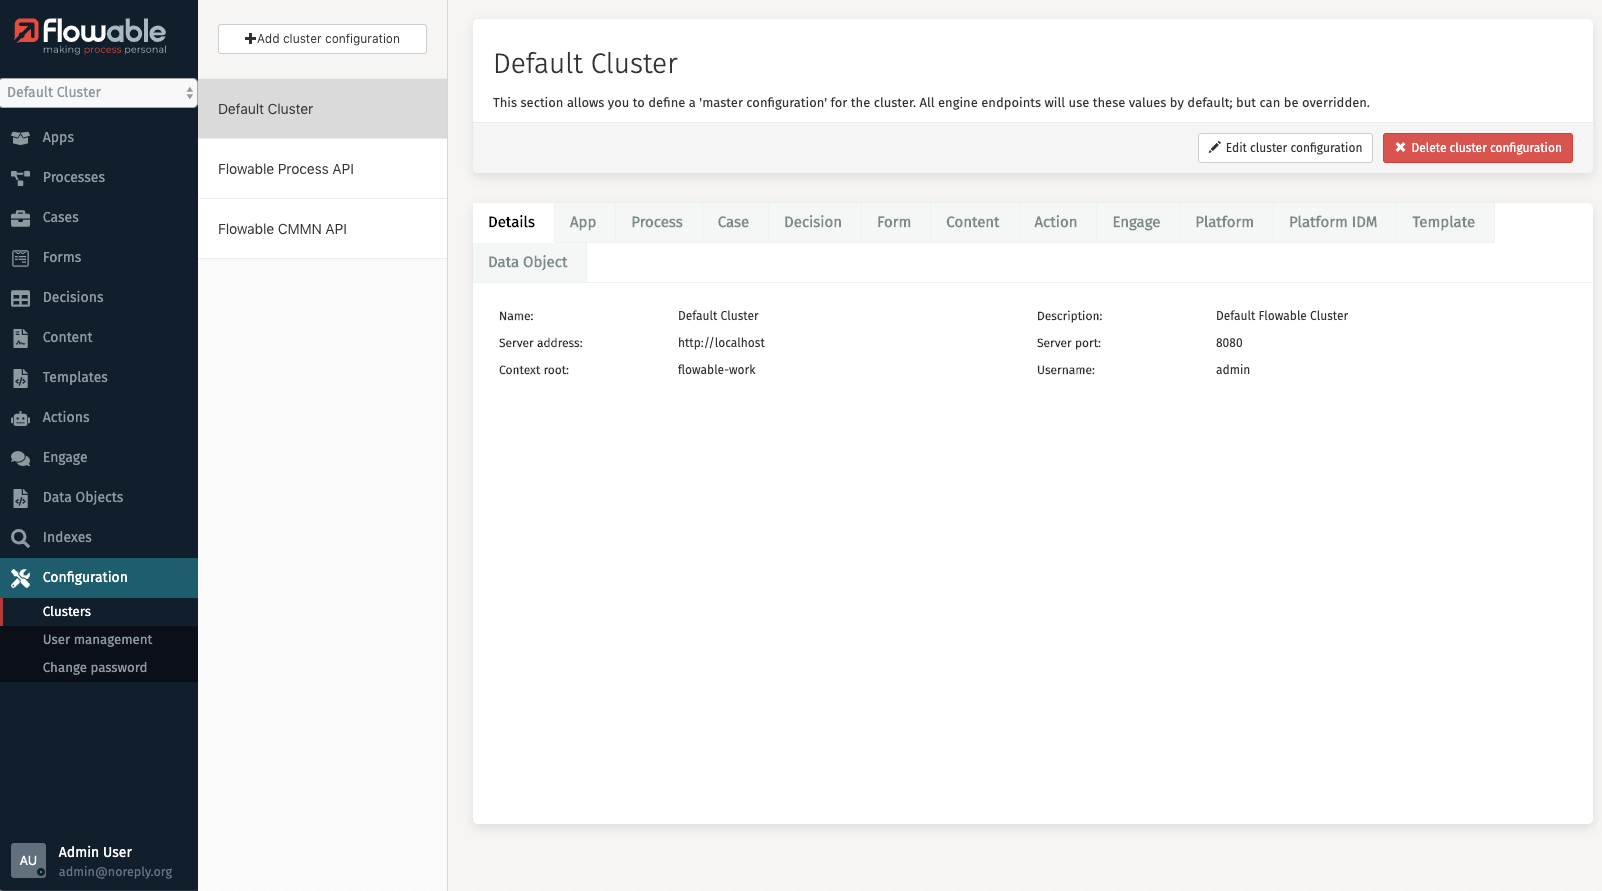
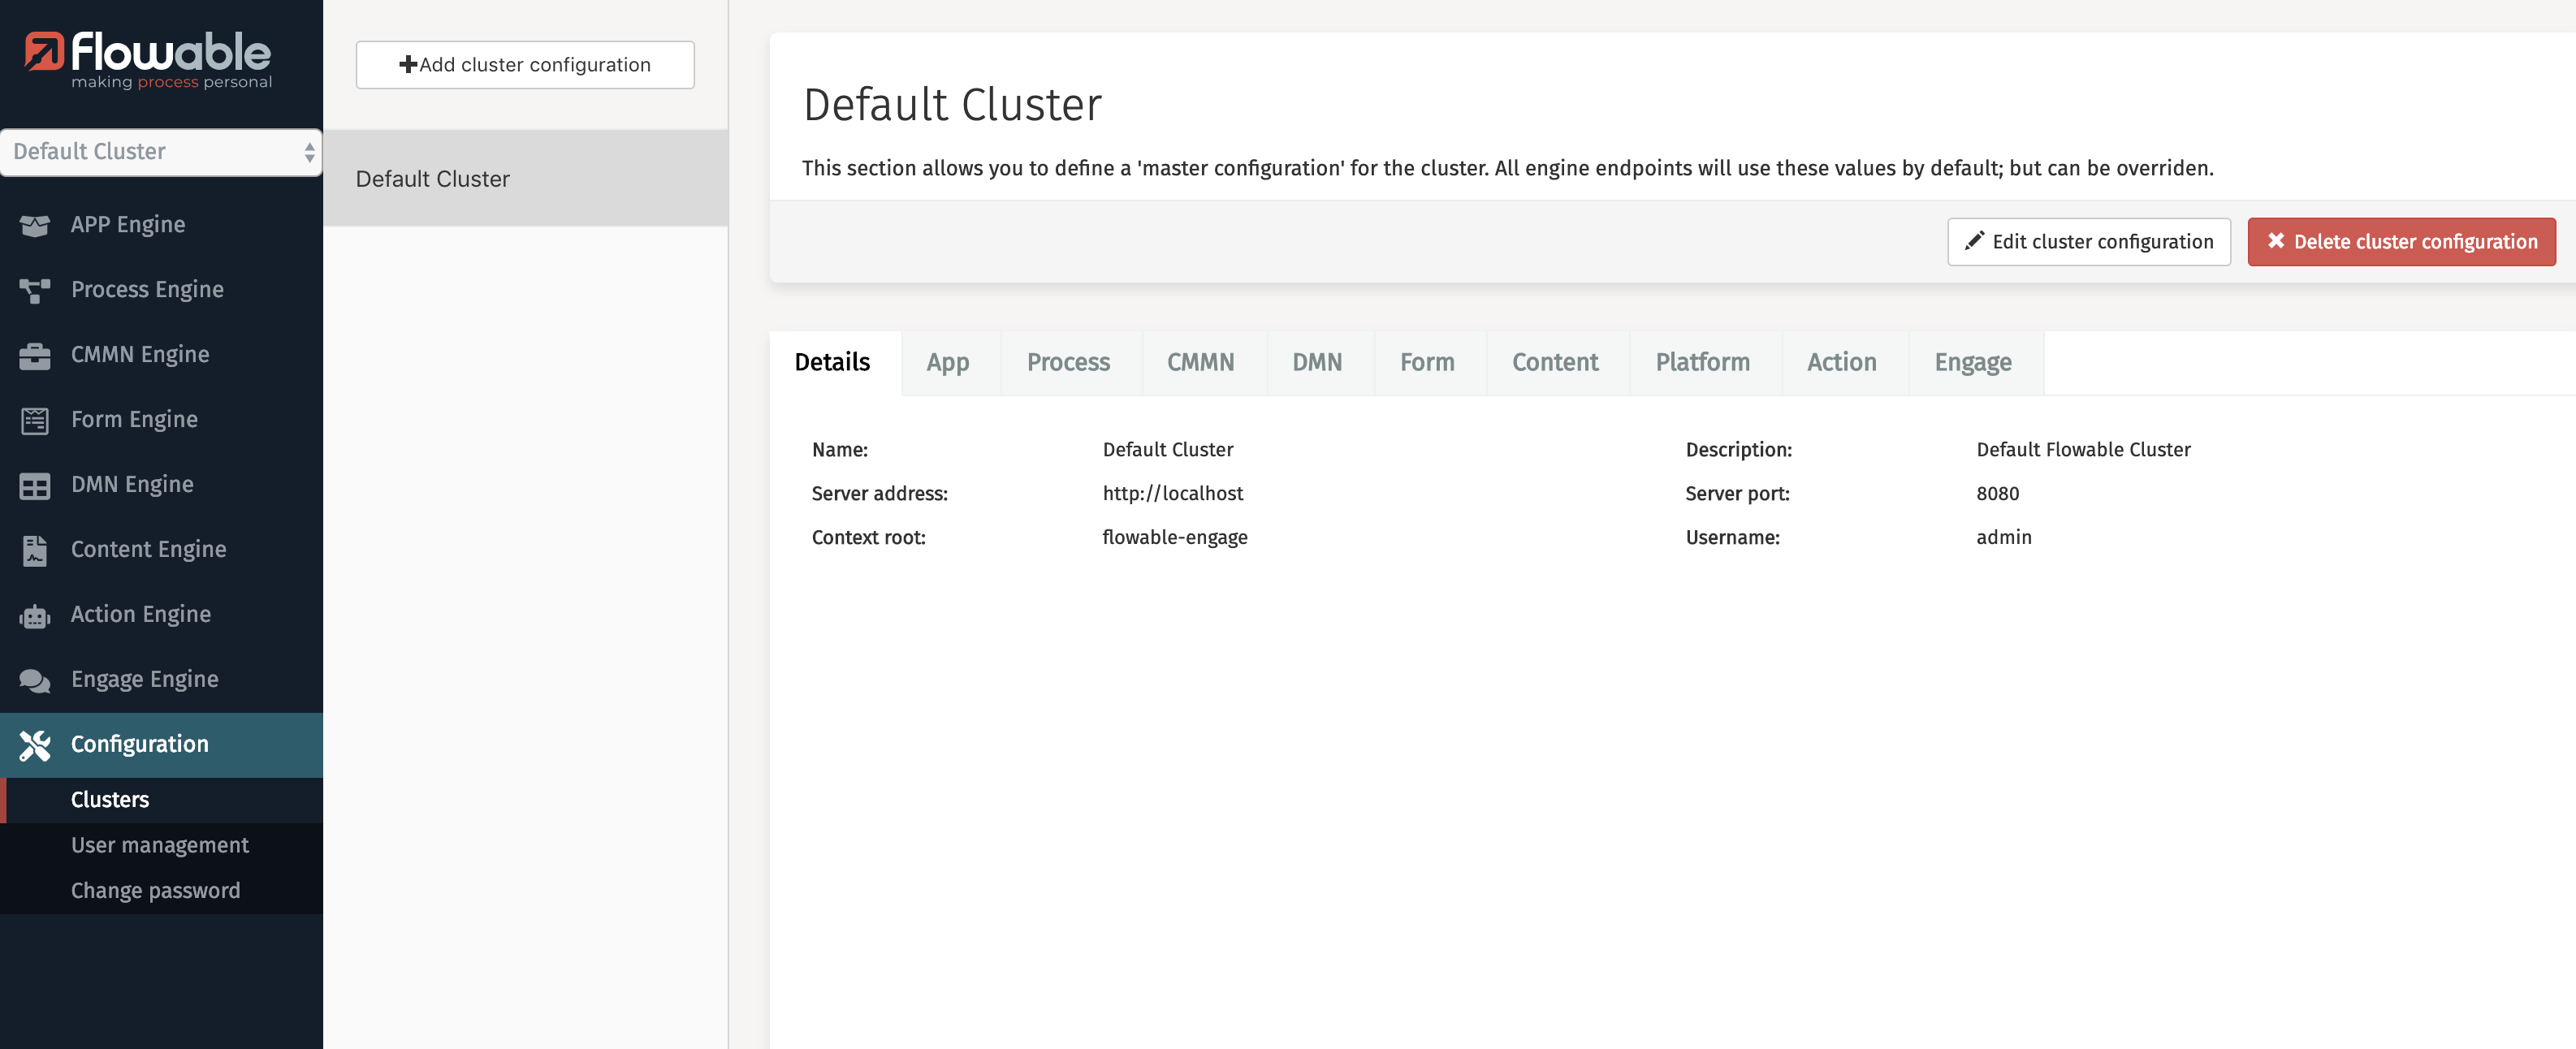
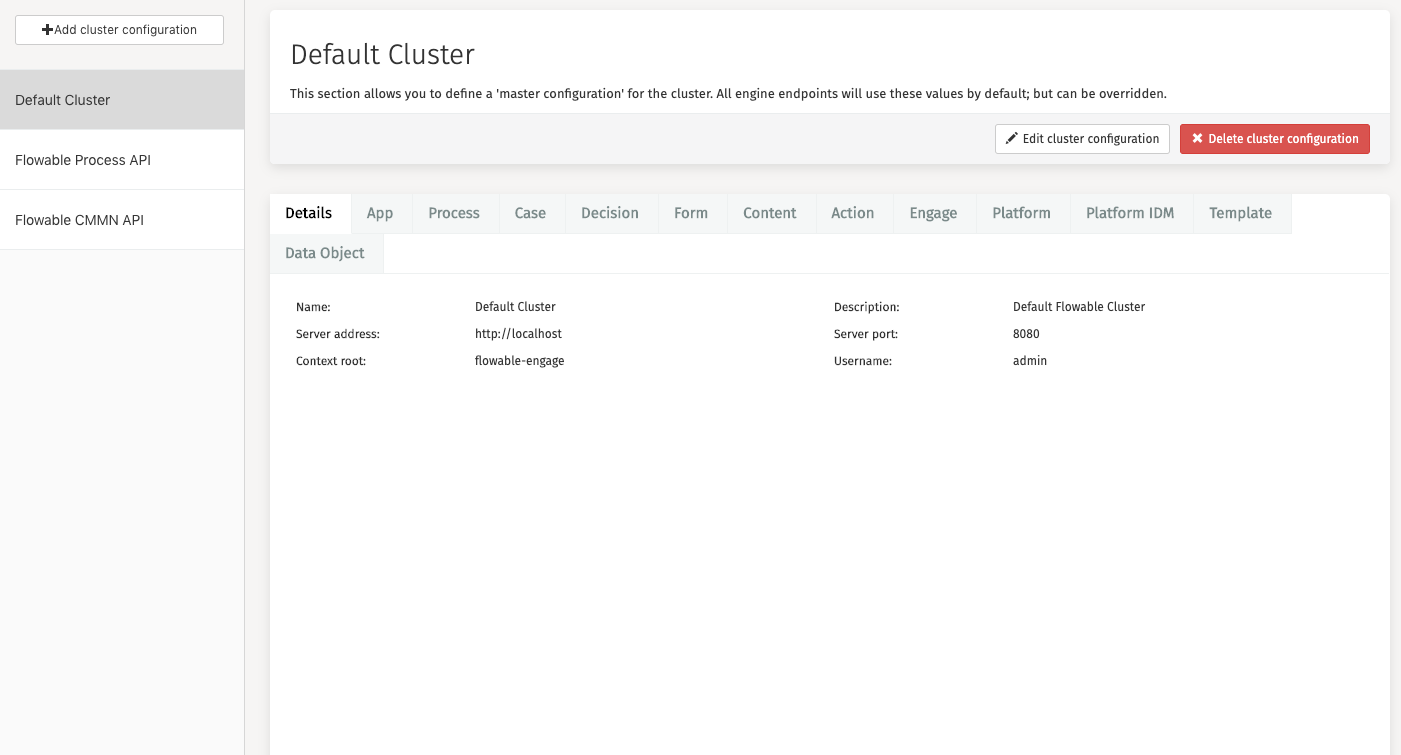
Manage a Cluster of Flowable Engines

From the same application, switch between different Flowable Engine servers to manage all aspects of your Flowable cluster.

020 general information4

Edit Data Entered in Error

If a form field has been completed incorrectly, edit its value to what was intended. If a process has taken a wrong path, change its state to jump back to an earlier step and run again. Combine setting variable values with changing state to jump a process and skip it forward as if the skipped steps had set the variables.

020 general information5

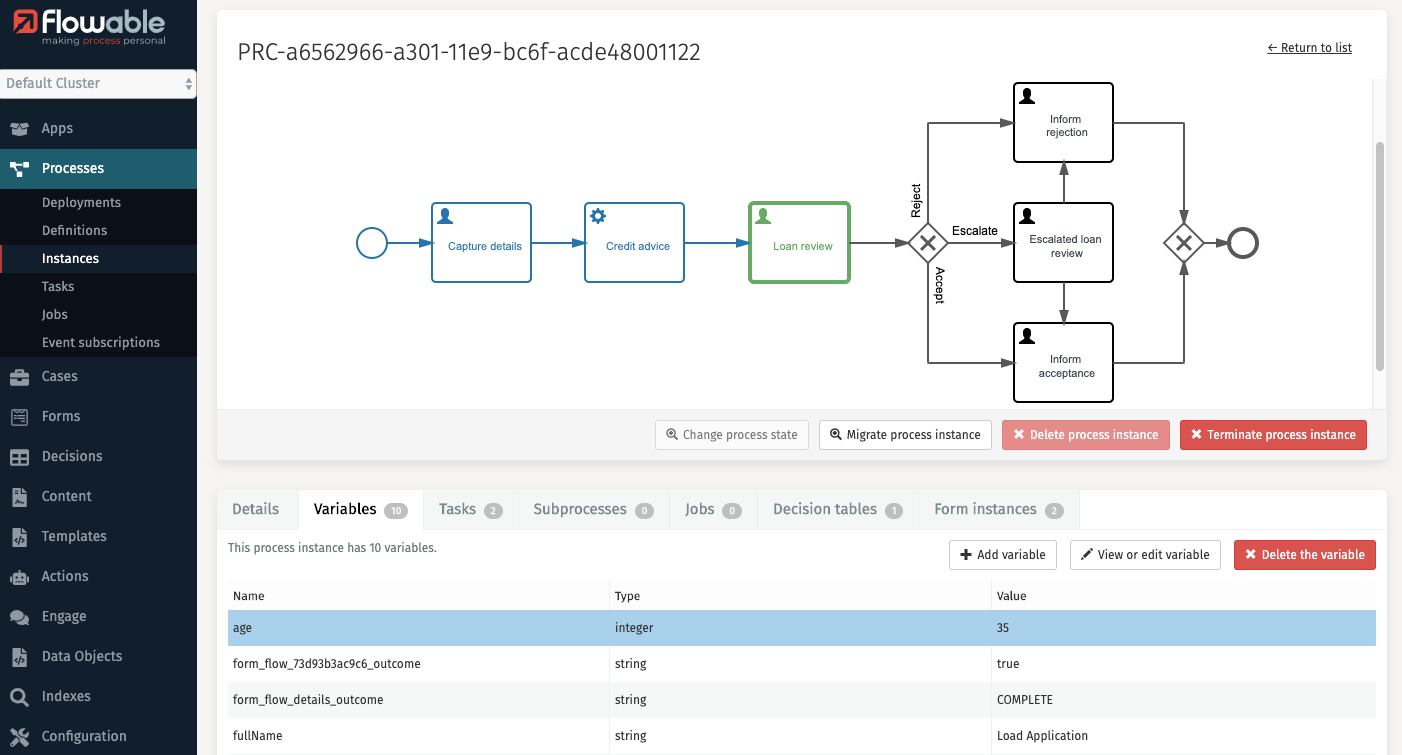
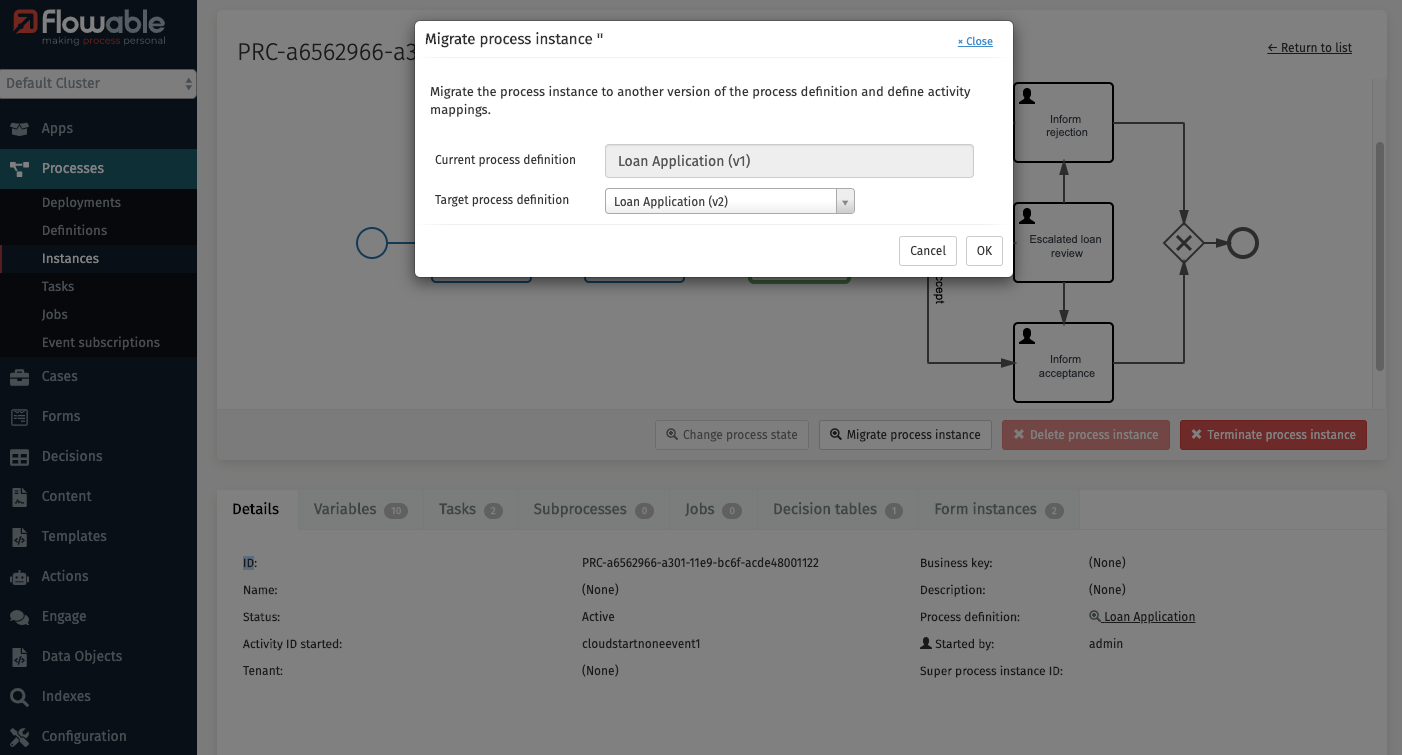
Process Instance Migration

When a new process definition is deployed, you may want existing process instances to use it rather than the definition they were started with. With process migration, you can define mappings from one process definition to another and apply it to process instances, whatever state they are in. Even complex migrations involving sub-processes and multi-instance states.

020 general information6

How to Log In

To access Flowable Control you need to type in the navigation URL into your browser. Once the page is loaded, the login dialog appears.

note

Your system administrator should provide you with the URL. The URL is typically something like https://<hostmachine>:<port>/flowable-control/.

100 login

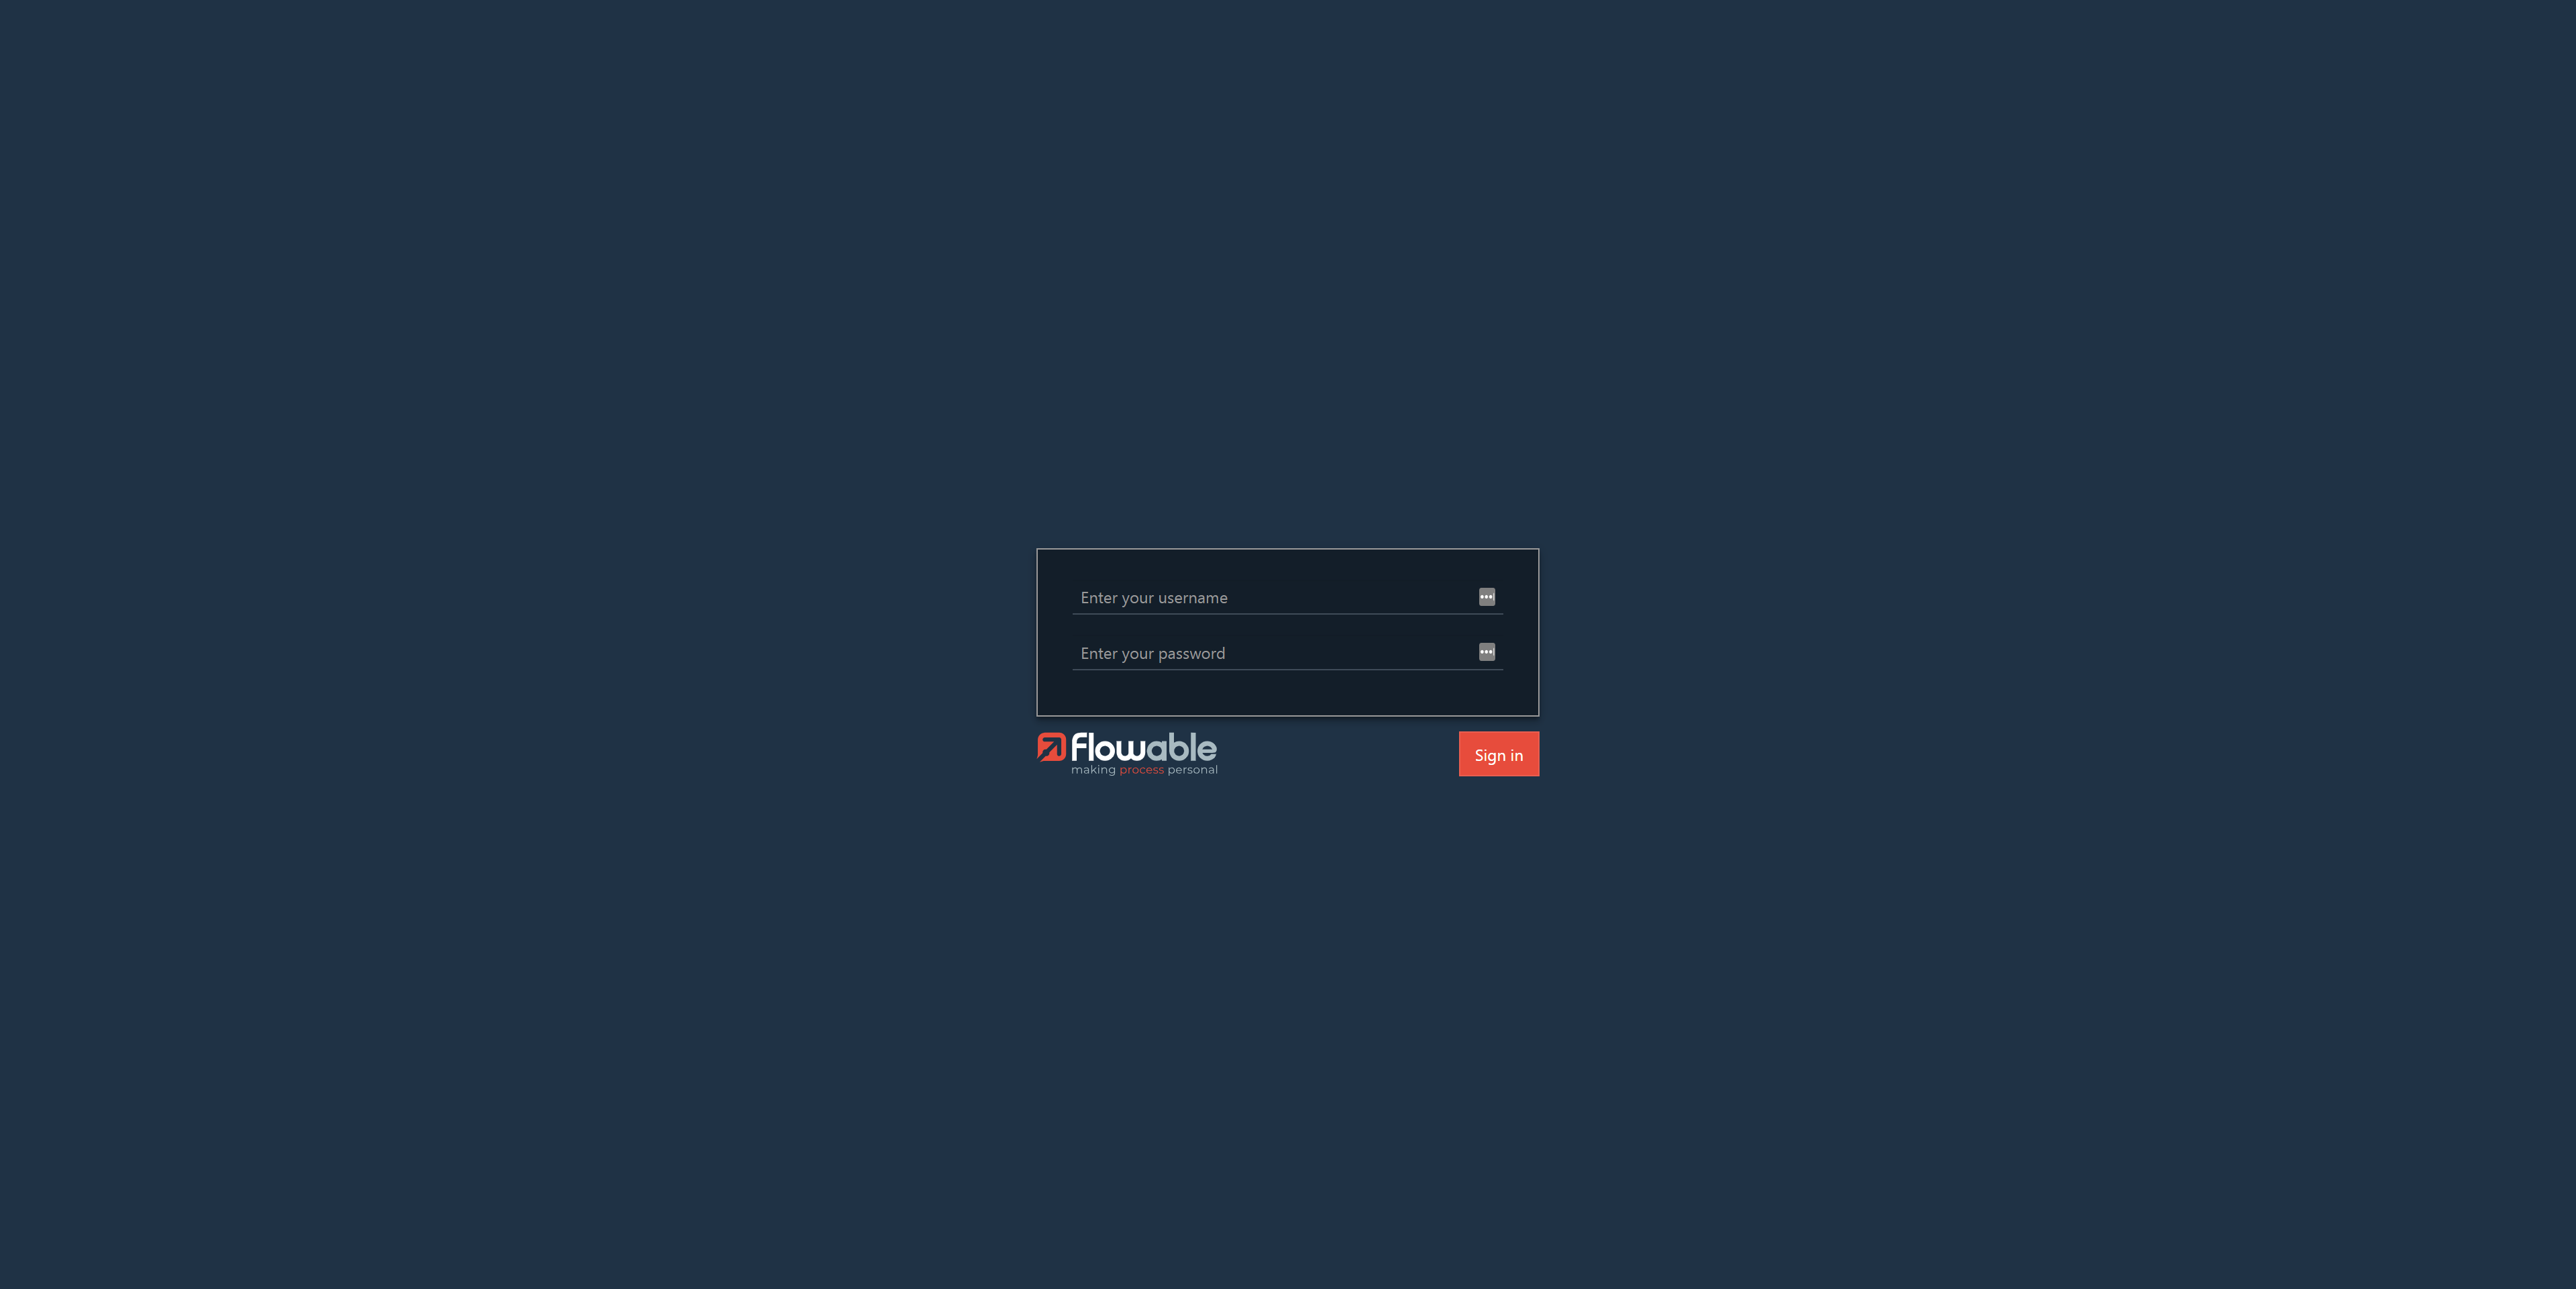
In order to log in, you need to type in your login and password on the form and click on Sign in.

User Interface

The Flowable Control user interface is divided into two areas:

  • The side panel on the left.

  • The message panel in the middle.

110 ui

Each area is described in the following sections.
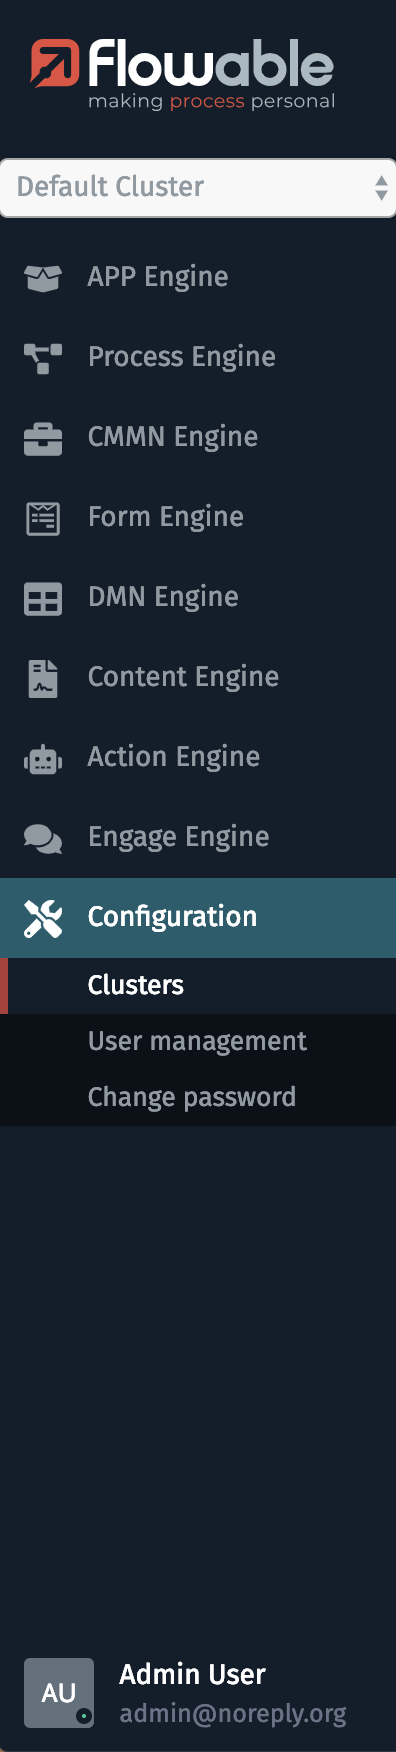
Side Panel

The side bar offers a simple tab-based navigation which allows you:

  • To open detailed views of all related items (e.g., Deployments, Definitions, Instances, …​) from the engines.

  • To open pages with more information on search indexes.

  • To open sections with some important configuration features.

110 side panel

Message Panel

The message panel shows more information about all the different items.

110 message panel

Read Only mode

Flowable Control will be in read only mode for non admin users. Features that delete, create or edit Flowable Control configuration items or that change Flowable engine state will not be shown.

More info on how to create admin and non admin users is available here

Configuration

In the Configuration section, there are three different items available that can be controlled and changed by the user.

Clusters

The section of the default cluster allows you to define a 'main configuration' for the cluster. This main configuration works like a template and all engine endpoints use these values by default.

200 cluster1

It is possible though to overwrite and edit the endpoints for all different engines. To do that you need to click on the Edit endpoint button and modify the settings. If a specific configuration differs from the default configuration, then a message appears at the top of the configuration settings.

200A edit endpoint

200B cluster2

To double-check whether your endpoint configurations are valid you can click the Check REST endpoint button. A valid endpoint configuration is indicated with a green message, and a red message signifies an error is present.

In Flowable Control multiple clusters can be managed. To add another cluster configuration, click the Add cluster configuration button.

200C add button

In the resulting dialog, fill in the appropriate values and click Save cluster configuration.

200D add dialog

To edit a cluster configuration, click the Edit cluster configuration button. A dialog opens where modifications to the configuration are made.

It is also possible to delete your cluster configuration by clicking the red Delete cluster configuration button in the header.

Cluster Permissions

v3.14.0+

Cluster permissions enable administrators to designate specific authorities with the capability to access cluster configurations. The system defaults to 'access-control' as the foundational authority level.

cluster permissions with access control

assign new cluster permissions

User Management

There are a few different actions you can perform in this section:

User Types

There are 2 user types; admin and non admin users. Admin users have full access to Flowable Control’s features. Non admin users privileges are defined by their assigned roles.

Create a User

One action you can perform in this section is creating an additional user for Flowable Control. To do that you first need to click the Create user button.

200E create button

Consequently, you need to fill in the dialog and click Save.

200F create dialog

Edit a User

Before using an action, you first need to select the user for which changes are required. The list of users can be narrowed by using the Search by name functionality on the left.

To change a user’s details first click the Select an action button and then the Change details button.

200G action

Clicking the button results in a dialog in which you can edit the user’s details.

200H details

Change a User’s Password

Changing a user’s password happens through clicking first the Select an action button and then the Change password button. A dialog opens where you can change the password of the user.

200I password

Delete a User

Deleting a user happens by first clicking the Select an action button and then the Delete button.

Role Management

There are a few different actions you can perform in this section:

Create a Role

One action you can perform in this section is creating an additional role for Flowable Control. To do that you first need to click the Create role button.

200E create role button

Consequently, you need to fill in the dialog and click Save.

200F create dialog

Edit Role privileges

Before using an action, you first need to select the role for which changes are required. The list of roles can be narrowed by using the Search by name functionality on the left.

To change a role’s details first click the Select an action button and then the Change privileges button.

200G action

Clicking the button results in a dialog in which you can edit the role’s privileges.

200H details

Assign a user to a role

Before using an action, you first need to select the role for which changes are required. The list of roles can be narrowed by using the Search by name functionality on the left.

To change a role’s details first click the Select an action button and then the Assign/unassign users button.

200G action

Clicking the button results in a dialog in which you can edit the role’s privileges.

note

The users are added as free text values. This allows assignments to roles with users of external authentication servers.

200H details

Dashboards

In the Dashboards sections, various dashboards are displayed that give insight into the system resource usage of each member of the current cluster, throughput metrics and instance overview data.

If the Dashboards section isn't available or no data is displayed in the charts, it could be that the system hasn't been set up properly. See the Administrator Guide for more details.

Dashboard Header

Every dashboard has a header at the top of the screen that looks as follows:

Dashboard Header

  • The Date range dropdown allows the display the data for time period: past hour|day|week|month|year or custom.
  • Next to the Date range dropdown is a refresh button. This will refresh all data currently displayed on the screen with the latest values.
  • The Date from and Date to fields become active when selecting custom in the Data range dropdown and can be used to visualize a custom date range.

Running Instances

This dashboard is only available when the currently selected cluster configuration points to a Flowable Work or Engage cluster.

The Running Instances dashboard shows the number of started process instances, case instances and tasks created in the selected time period. The pie charts on the right-hand side show the top ten of most started definitions in that same period.

Running Instances Dashboard

Completed Instances

This dashboard is only available when the currently selected cluster configuration points to a Flowable Work or Engage cluster.

The Completed Instances dashboard shows the number of process instances, case instances and tasks that were completed in the given time period. The pie charts on the right-hand side show the top ten of most completed definitions in that same period.

Completed Instances Dashboard

Multi-Node Charts

A Flowable cluster setup typically consists of multiple instances or nodes. The dashboards that benefit from getting insight into how the different nodes compare to each other include this information: when hovering a datapoint in the chart, the node name is displayed.

All charts in the next sections are multi-node charts.

Multiple Nodes on Dashboard

System Resources

This dashboard displays system resource usage for each node of the currently selected cluster.

The Average CPU Usage chart displays what percentage of the CPU was used by each Flowable instance:

Average CPU Usage Chart

The Average Memory Usage chart shows the memory (in megabytes) used by each Flowable instance:

Average Memory Usage Chart

The number shown on this chart is the JDK heap and non-heap memory combined.

The Max Active Database Connections chart shows how many database connections were active in the given time frame.

Max Active Database Connections Chart

Note that an 'active' connection is one that was actively used for the time period, not how many connections are pooled by the internal connection pools. As such, a system doing nothing will show zero 'max active connections', even when connections are pooled by the connection pool. This number thus can differ from what can be seen on the database monitoring side.

Engine Operations

This dashboards displays high-level throughput numbers for each Flowable instance in the cluster.

The Engine Operations chart give an insight at how many low-level engine operations were executed:

Engine Operations Chart

Technically, the 'operation' measured here is the amount of Flowable commands being executed. Each Flowable API usage corresponds with a number of low-level commands that are the building blocks of every Flowable engine.

The REST Requests chart displays the overall count of REST calls executed against each individual instance:

Engine Operations Chart

Async Executors

This dashboard gives insight into the internal working of the Flowable async executor. This component is responsible for executing asynchronous task (e.g. service tasks, scripts, etc.), timers and history jobs (jobs that are used to process historical data and/or to publish the data to Elasticsearch).

This is an important dashboard to keep an eye on if you're using lots of asynchronous steps in processes and/or cases.

The first chart, Async Executor Threadpool shows the internal threadpool size. The async executor uses various threadpools to execute the asynchronous work. Each node has various threadpools. In the following screenshot, the three different colored lines indicate the fluctuating size of three different threadpools. Hovering the datapoints will show the actual threadpool.

Async Executor Thread Pool Size

In this particular screenshot, two threadpools are maxed out to 8 for multiple minutes after each other. This typically indicates that the system is under load and the threadpool configuration could be tweaked to be larger in size (also potentially making the connection pool max size higher) to cope with the higher load.

The Jobs executed by Async Executors shows the overall number of jobs executed in the system, regardless of the type of job (async, timer, history, etc.):

Async Executor Jobs Executed

Charts for each individual type of job can be found in the Job Execution dashboard.

The Async Executor Average Execution Time displays the average execution time for jobs:

Async Executor Average Execution Time

Long running jobs will keep a threadpool blocked while executing. If this chart shows high average times and the amount of threads in the threadpool is small (monitored by the first chart), this could lead to bad performing systems.

The Async Executor Maximum Execution Time similarly displays the maximum job execution time for the given time period shown:

Async Executor Maximum Execution Time

The Async Executor Queued Number of Jobs chart shows the jobs that are being queued internally. The async executor uses an internal queue to store jobs temporarily when threads are busy.

Async Executor Queued Jobs

In an ideal setup, the queued number should be zero or close to zero. As shown in the screenshot, when suddenly load increases on a system there can be a sudden spike on queued jobs. That's okay, if it's a spike that goes away over time. However, if this persists, it typically indicates that not enough threads are available for handling the load.

Job Execution

In this dashboard, the focus is on the succesful execution of the different job types. Together with the Async Executors dashboard, it gives a good insight in how the async executor component is handling all jobs in the system.

There is a chart for each main type of job. The first one is the Async Jobs Executed chart, which shows how many asynchronous jobs (like asynchronous service tasks or other task types) have been succesfully executed:

Async Jobs Executed

The next chart is the Timer Jobs Executed and similarly shows the timer jobs which were executed:

Timer Jobs Executed

This is related to - but not the same - as the following chart, which is the Timer Jobs Scheduled chart:

Timer Jobs Scheduled

The difference between the two charts is that timers can be scheduled a long time before they are actually executed.

In the last chart, History Jobs Executed, the amount of history jobs are displayed. These kinds of job are used a lot in Flowable Work, for example for asynchronous history and to send indexed data in bulk to Elasticsearch for querying and user dashboards.

History Jobs Executed

Job Failure

While the Job Execution dashboard tells us everything about the throughput of job executions in the system that were succesful, this dashboard zooms in on failing jobs.

New Deadletter Jobs

The charts shown here are similar to the ones in the Job Execution dashboard: one for each type (async, timer and history) and two new charts:

  • The Rejected Jobs chart shows the amount of jobs that were rejected. This is not the same as a job that for example failed due to an exception that happened. Job rejection happens when the job queue (which is monitored in the Async Executors dashboard) is full. At that point, all threads of the async executor threadpool are busy and the queue for temporary holding the jobs before execution is also full. To avoid overloading the instance, new jobs are rejected such that other instances can attempt to pick them up and execute them.
  • When a job fails (due to an exception), the job is retried three times with a wait period in between retries. Both the number of retries and the wait time is configurable. The New Deadletter Jobs chart shows the jobs that kept failing and have become a 'deadletter job'. An administrator can manually move the job back to become executable (e.g. because a 3rd-party system that was down before, and led to job failure, is now up and running again).

Keeping an eye on the Rejected Jobs chart is a good idea. It's not a good sign when jobs are rejected and definitely not if repeated patterns of rejection start to show.

New Deadletter Jobs

Eventregistry

This dashboard shows metrics around the Flowable event registry. Currently, it displays the events received in the system:

Events Received Chart

Each differently colored line here represents a different type of event that is handled. The event type is shown when hovering over a datapoint.

Active Users

This dashboard is only available when the currently selected cluster configuration points to a Flowable Work or Flowable Engage cluster.

This dashboard displays the unique users using the system. It shows the overall number of users across all instances or per instance.

Active Users Chart

At the top of the page, the total number is shown. This is useful, as in the screenshot example above, the chart never shows more than 8 unique users at any point in time. However, seen over the time period, 23 different unique users have used the system (but never more than 8 different users at the same time).

Apps

In the Apps section, there are different items available that can be explored and controlled by the user.

These items are:

App Deployments

By default, the deployment section is opened. In this section, you can find all the app deployments that are completed in your environment. The 'Name' and 'Tenant identifier' fields can be used to narrow down the list of deployments.

250 deployments

In Flowable Control it is possible to upload apps through the Upload App button.

250A upload button

250B upload dialog

Clicking on a deployment opens a new page with detailed information about this deployment.

250C details

The Delete deployment button can be used to delete that deployment from your environment.

250D delete button

App Definitions

The second tab, App definitions, presents a filtered overview of all app definitions that belong to the deployment you selected earlier.

250E app definitions

It is also possible to browse through all definitions across all apps. This is done by clicking 'Definitions' in the side panel. There are some filters in the header available to assist you in your search for a particular app definition.

250F app definitions

Clicking on an app definition opens a new page with detailed information about the app definition.

note

By clicking on a 'deployment', the details of that deployment are shown.

250G details

Other linked items that can be explored and controlled at the app definition section are:

Processes

In the Processes section there are different items available that can be explored and controlled by the user.

These items are:

Process Deployments

By default, the deployment section is opened. In this section, you can find all the process deployments that are completed in your environment. The 'Name' and 'Tenant identifier' fields can be used to narrow down the list of deployments.

300 deployments

In Flowable Control it is possible to upload processes through the upload button, a dialog is opened after clicking the Upload process or package button.

300A upload dialog

Clicking on a deployment opens a new page with detailed information about the deployment.

300B details

The Delete deployment button is used to delete that deployment from your environment.

300D delete

Process Definitions

The second tab, Process definitions, presents a filtered overview of all process definitions that belong to the deployment you selected earlier.

300E process

It is also possible to browse through all definitions across all processes. This is done by clicking 'Definitions' in the side panel. There are some filters in the header available to assist you in your search for a particular process definition.

300F definitions

Clicking on a process definition opens a new page with detailed information and a visual representation of the process definition.

300G details

Other linked items that can be explored and controlled at the process definition section are:

Process Instances

Process instances represent the active and completed sessions of a process. Clicking this tab on the process definition page results in an overview of all process instances that are linked to that process definition.

300H process

It is also possible to browse through all instances across all processes. This is done by clicking 'Instances' in the side panel. There are some filters in the header available to assist you in your search for a particular process instance.

300I process instances

Clicking on a process instance opens a new page with detailed information and a visual representation of the process instance. The visual representation on top shows which path a process has followed. Blue stands for 'completed', green for 'currently active' and grey for 'not active yet'.

300J details

note

By clicking the Migrate process instance button, you can migrate the process instance to another version of the process definition and define activity mappings.

300K migrate

Whenever an App is deployed, all of the models within it are deployed to the runtime of Flowable Work. An App is deployed as a new version every time you deploy it, to make it entirely consistent and compatible with all the models it contains. By default, the deployment mechanism uses a safe strategy of not migrating existing instances to the new models, including cases, processes, and tasks. This means they are mapped to precisely the version they were created with until they are either completed or migrated to a newer version. So, even with an updated form in an App, existing instances of the App continue to display and use the older version of the form. With this button you can migrate the process instance to any other version you like.

note

By clicking the Terminate process instance button, you can terminate the process instance with an optional delete reason.

Other linked items that can be explored, modified, or controlled at the process instance section are:

Variables can be added, edited, and deleted which could be handy for debugging or repairing parts of your process.

Tasks

Clicking on 'Tasks' in the side panel results in an overview of all process tasks. There are some filters in the header available to assist you in your search for a particular process task.

300L tasks

After clicking one of these tasks, a new page with the detailed information is displayed. As an administrator, you can perform actions such as editing, assigning, claiming, delegating, or completing the task.

300M details

Other linked items that can be further explored or controlled at this section are:

  • Sub tasks

  • Variables

  • Identity links

Jobs

Clicking on 'Jobs' in the side panel results in an overview of all jobs of a particular type. These are all the job types that exist:

  • Executable jobs

  • Timer jobs

  • Suspended jobs

  • Deadletter jobs

There are also some other filters in the header available to assist you in your search for a particular job.

300N jobs

After clicking on a specific job, a new page with detailed information is displayed. As an administrator, you can move or delete the job.

300O jobs

Event Subscriptions

Clicking on 'Event subscriptions' in the side panel results in an overview of all process event subscriptions. There are some filters in the header available to assist you in your search for a particular process event subscription.

300P events

Opening an event subscription results in a page with detailed information. From this page, you are also able to navigate further to the process instance of the process definition. As an administrator, you can manually trigger the event.

300Q events

Cases

In the Cases section there are different items available that can be explored and controlled by the user.

These items are:

Case Deployments

By default, the deployment section is opened. In this section, you can find all the case deployments that were completed in your environment. The 'Name' and 'Tenant identifier' fields can be used to narrow down the list of deployments.

400 deployments

In Flowable Control it is possible to upload cases through the upload button, a dialog is opened after clicking the Upload case or package button.

400A upload dialog

Clicking on a deployment opens a new page with detailed information about this deployment.

note

You can navigate directly to the details of the app (= the parent element of our case), by clicking the 'parent deployment id'.

400B details

The Delete deployment button is used to delete that deployment from your environment.

400C delete

Case Definitions

The second tab, Case definitions, presents a filtered overview of all case definitions that belong to the deployment you selected earlier.

400D case defs

It is also possible to browse through all definitions across all cases. This can be done by clicking 'Definitions' in the side panel. There are some filters in the header available to assist you in your search for a particular case definition.

400E definitions

Clicking on a case definition opens a new page with detailed information and a visual representation of the case definition.

400F details

Other linked items that can be explored and controlled at the case definition section are:

Case Instances

Case instances represent the active and completed sessions of a case. Clicking this tab on the case definition page results in an overview of all case instances that are linked to that case definition.

400G instances

It is also possible to browse through all instances across all cases. This can be done by clicking 'Instances' in the side panel. There are some filters in the header available to assist you in your search for a particular case instance.

400H instances

Clicking on a case instance opens a new page with detailed information and a visual representation of this case instance. This visual representation on top shows which path a case has followed. Blue stands for 'completed', green for 'currently active' and grey for 'not active yet'.

400I details

note

By clicking the Terminate case instance button, you can terminate the case instance with an optional delete reason.

Other linked items that can be explored, modified, or controlled at the case instance section are:

Variables can be added, edited, and deleted, which is handy for debugging or repairing parts of your case.

Case Tasks

Clicking on 'Tasks' in the side panel results in an overview of all case tasks. There are some filters in the header available to assist you in your search for a particular case task.

400J tasks

After clicking one of these tasks, a new page with the detailed information is displayed. As an administrator, you can perform actions such as editing, assigning, claiming, delegating, completing, or deleting the task.

400K details

Other linked items that can be further explored or controlled at this section are:

  • Sub tasks

  • Variables

  • Identity links

Case Jobs

Clicking on 'Jobs' in the side panel results in an overview of all jobs of a specific type. These are all the job types that exist:

  • Executable jobs

  • Timer jobs

  • Suspended jobs

  • Deadletter jobs

There are also some other filters in the header available to assist you in your search for a particular job.

400L jobs

After clicking on a specific job, a new page with detailed information is displayed. As an administrator, you can move or delete the job.

400M jobs

Forms

In the Forms section there are different items available that can be explored and controlled by the user.

These items are:

Form Deployments

By default, the deployment section is opened. In this section, you can find all the form deployments that were completed in your environment. The 'Name' and 'Tenant identifier' fields can be used to narrow down the list of deployments.

500 deployments

In Flowable Control it is possible to upload forms through the upload button, a dialog is opened after clicking the Upload form button.

500A upload dialog

Clicking on a deployment opens a new page with detailed information about this deployment.

note

You can navigate directly to the details of the app (= the parent element of our form), by clicking the 'parent deployment id'.

500B details

The Delete deployment button is used to delete that deployment from your environment.

500C delete

Form Definitions

The second tab, Form definitions, presents a filtered overview of all form definitions that belong to the deployment you selected earlier.

500D forms

It is also possible to browse through all definitions across all forms. This can be done by clicking 'Definitions' in the side panel. There are some filters in the header available to assist you in your search for a particular form definition.

500E definitions

Clicking on a form definition opens a new page with detailed information and a visual representation of the form definition.

500F details

Other linked items that can be explored and controlled at the form definition section are:

  • Form instances

Form Instances

Form instances represent the sessions of a form. Clicking this tab on the form definition page results in an overview of all form instances that are activated for that form definition.

500G forms

It is also possible to browse through all instances across all forms. This is done by clicking 'Instances' in the side panel. There are some filters in the header available to assist you in your search for a particular form instance.

500H instances

Clicking on a form instance opens a new page with detailed information and a visual representation of the form.

500I details

Decisions

In the Decisions section there are different items available that can be explored and controlled by the user.

These items are:

Decision Deployments

By default, the deployment section is opened. In this section, you can find all the Decision deployments that were completed in your environment. The 'Name' and 'Tenant identifier' fields can be used to narrow down the list of deployments.

600 deployments

In Flowable Control it is possible to upload decisions by clicking the Upload decision button which opens an upload dialog.

600A upload dialog

Clicking on a deployment opens a new page with detailed information about this deployment.

note

You can navigate directly to the details of the app (that is, the parent element of the decision), by clicking the 'parent deployment id'.

600B details

The Delete deployment button is used to delete that deployment from your environment.

600C delete

Decision Tables

The second tab, Decision tables, presents a filtered overview of all decision tables that belong to the deployment you selected earlier.

600D decision

It is also possible to browse through all decision tables across all DMN deployments. This is accomplished by clicking Decision tables in the side panel. There are some filters in the header available to assist you in your search for a particular decision table.

600E decision

Clicking on a decision table opens a new page with detailed information about this decision table.

600F details

Other linked items that can be explored and controlled at the decision table section are:

  • Decision Audits (Executions)

Executions (Decision Audits)

Executions represent the sessions of a decision table. Clicking this tab on the Decision audits page results in an overview of all decision tables that are activated for that execution.

600G audits

It is also possible to browse through all executions across all DMN deployments. This is done by clicking 'Executions' in the side panel. There is a tenant identifier filter in the header available to assist you in your search for a particular execution.

600H executions

Clicking on an execution opens a new page with detailed information about this execution.

600I details

Other linked items that can be explored or controlled at the execution section are:

  • Audit View

  • Audit Data

The audit view represents a visual overview of the taken decision.

600J audit view

The audit data represents a textual overview of the taken decision.

600K audits

Content

In the Content section all stored and uploaded files are found, and there are different items available that can be explored and controlled by the user.

These items are:

Content Deployments

By default, the deployment section is opened. In this section, you can find all the content deployments that are completed in your environment. The 'Name' and 'Tenant identifier' fields can be used to narrow down the list of deployments.

650 deployments

By clicking on the Upload document button new content can be uploaded into the environment.

650 upload

Clicking on a deployment opens a new page with detailed information about the deployment.

650 details

Content Definitions

The second tab, Content definitions, presents a filtered overview of all content definitions that belong to the deployment you selected earlier.

650 content definition

It is also possible to browse through all content in the environment. This is done by clicking 'Definitions' in the side panel. There are some filters in the header available to assist you in your search for a particular document definition.

650 definitions

Clicking on a content definition opens a new page with detailed information and a visual representation of the content definition.

650 definition detail

Content Items

In this section, you can find all the content items that were stored or uploaded in your environment. The 'Name' and 'Tenant identifier' fields can be used to narrow down the list of content items.

650 items

Clicking on a content item opens a new page with detailed information about this content.

650A content details

note

By clicking the 'Show content item' button, you can display a preview of your content item.

note

By clicking the 'Download content item' button, you can download the content item.

Content Renditions

The second tab, Renditions, presents information about the renditions of the content.

650 rendition

It is also possible to browse all content renditions in the environment. This is done by clicking Content renditions in the side panel. There are some filters in the header available to assist you in your search for a particular document definition.

650 content renditions

Clicking on a content rendition opens a new page with detailed information and a visual representation of the content rendition.

650 rendition detail

note

By clicking the 'Download rendition' button, you can download the content item.

Templates

In the Templates section there are different items available that can be explored and controlled by the user.

These items are:

Deployments

By default, the deployment section is opened. In this section, you can find all the Template deployments that are available in the environment. The 'Name' and 'Tenant identifier' fields can be used to narrow down the list of deployments.

675 deployments

In Flowable Control it is possible to upload templates through the upload button, a dialog is opened after clicking the Upload template button.

You can aquire the template file you need from Flowable Design by selecting the "Deployable app zip for direct upload to Flowable engines" option when you export your app. In that zip file you will see the .tpl files. Once you have extracted them you can upload them in Flowable Control, using this option.

675A upload dialog

Clicking on a deployment opens a new page with detailed information about the template deployment.

675B details

The Delete deployment button is used to delete that deployment from your environment.

675C delete

Definitions

The second tab, Template Definitions, presents a filtered overview of all templates that belong to the deployment you selected earlier.

675D definitions

It is also possible to browse through all templates across all the deployments. This is accomplished by clicking Definitions in the side panel. There are some filters in the header available to assist you in your search for a particular template.

675E definitions

Clicking on a template opens a new page with detailed information about this template file.

675F details

Variation Definitions

The third tab, Template Variation Definitions, displays the templates with its associated Variation key and Definition key.

675G variations

It is also possible to browse through all executions across all Decision deployments. This is done by clicking 'Variation definitions' in the side panel. There is a tenant identifier filter in the header available to assist you in your search for a particular execution.

675H variations

Clicking on an execution opens a new page with detailed information about the template variation.

675I details

Actions

In the Actions section there are different items available that can be explored and controlled by the user.

These items are:

Action Deployments

By default, the deployment section is opened. In this section, you can find all the action deployments that were completed in your environment. The 'Name' and 'Tenant identifier' fields can be used to narrow down the list of deployments.

700 deployments

Clicking on a deployment opens a new page with detailed information about this deployment.

700A details

The Delete deployment button is used to delete that deployment from your environment.

700B delete

Action Definitions

The second tab, Action definitions, presents a filtered overview of all action definitions that belong to the deployment you selected earlier.

700C actions

It is also possible to browse through all definitions across all actions. This is done by clicking 'Definitions' in the side panel. There are some filters in the header available to assist you in your search for a particular action definition.

700D definitions

Clicking on an action definition opens a new page with detailed information about this action definition.

700E details

Other linked items that can be explored and controlled at the action definition section are:

  • Instances

Instances

Instances represent the active sessions of an action. Clicking this tab on the action definition page results in an overview of all action instances that are activated for that process definition.

700F instances

It is also possible to browse through all instances across all processes. This is done by clicking 'Instances' in the side panel. There are some filters in the header available to assist you in your search for a particular action instance.

700G instances

Clicking on an action instance opens a new page with detailed information about this action instance.

700H details

Data Objects

In the Data Objects section there are different items available that can be explored and controlled by the user.

These items are:

Data Deployments

By default, the deployment section is opened. In this section, you can find all the data object deployments that were completed in your environment. The 'Name' and 'Tenant identifier' fields can be used to narrow down the list of deployments.

750 deployments

Clicking on a deployment opens a new page with detailed information about this deployment.

750A details

The Delete deployment button is used to delete that deployment from your environment.

750B delete

Data Object Definitions

The second tab, Data Object Definitions, presents a filtered overview of all data object definitions that belong to the deployment you selected earlier.

750C actions

It is also possible to browse through all definitions across all data objects. This is done by clicking 'Definitions' in the side panel. There are some filters in the header available to assist you in your search for a particular data object definition.

750D definitions

Clicking on a data object definition opens a new page with detailed information about this data object definition.

750E details

Master Data Object Definitions

If the dataObjectType of the opened definition equals masterData, you are also able to:

750F import instances

  • delete all instances of the current master data definition.
  • import instances for that master data.

750G import instances dialog

  • see a filterable overview of all instances of that definition. Clicking on one instance will open the details view.v3.14.0+

750G master data instances tab

  • create a single master data instancev3.14.0+

750G create single instance dialog

Schema Definitions

The third tab, Schema Definitions, presents a filtered overview of all data object schema definitions. Changes to data object definitions might require modifications on tables, columns, constraints, etc. within the database. This interference in the Flowable environment is substantial. To avoid side effects, these changes are not automatically done during deployment and require user interaction to be rolled out.

750H data object schema definitions

Clicking on a schema definition opens a new page with detailed information about this schema definition.

750H data object schema definition details

You can use the buttons to either update your database or roll back the changes.

Learn more about schema definitions

note

Master data object definitions are handled differently. They do not require database updates.

Master Data Instances

Clicking the Master Data Instances section results in an overview of all available master data instances.

750I master data instances

You can use the Definition filter to reduce the instances based on one data object definition. Selecting the Definition filter enables the Download all matches button. Clicking it will download all matches in a JSON format.

750I master data instances

note

The downloaded json file is immediately (re)importable.

Single Master Data Instance

v3.14.0+

Clicking a single master data instance from the master data instances view or the instances tab of master data object definitions will open the details view for single master data instances.

750J single master data instance

You can also delete or update the current master data instance.

750J update single master data instance

Engage

In the Engage section there is only one item available that can be explored and controlled by the user: Conversations.

Conversations

In this section, you can find all the conversations that were completed in your environment. The 'Name' and 'Tenant identifier' fields can be used to narrow down the list of conversations.

800 conversations

Clicking on a conversation opens a new page with detailed information about the conversation.

800A details

Messages

The second tab, Messages, presents a filtered overview of all messages that belong to the conversation you selected earlier.

800B messages

Clicking on a message opens a new page with detailed information about the message.

note

By clicking the Delete message button, you can delete a message from the conversation.

800C message detail

Users

You can manage the Flowable Work/Engage Users in Flowable Control. For further details please refer to this how-to.

Indexes

In the Indexes section several Elasticsearch indexes can be queried by the user.

Work

By default, the Work section is opened. In this section, you can find all the work instances present in this Elasticsearch index.

The default search filter shows All work instances, but it can be narrowed to show Active work instances or Completed work instances.

The default search filter also has Any type active but can be narrowed to show either Processes or Cases.

In addition to the above, the following fields can be added to the filter: Instance ID, Name, Definition ID, Definition name, and Definition key.

900 work instances

Clicking on a work instance shows the indexed document.

900A work instances

The Reindex work instances button is used to trigger a reindex.

900B work instances

Processes

In this section, you can find all the process instances present in this Elasticsearch index.

The default search filter shows All process instances, but it can be narrowed to show only Active process instances or Completed process instances.

In addition to the process state, the following fields can be added to the filter: Instance ID, Definition name and Definition key.

900 process instances

Clicking on a process instance shows the corresponding indexed document.

900A process instances

The Reindex process instances button is used to trigger a reindex.

900B process instances

Cases

In this section, you can find all the case instances present in this Elasticsearch index.

The default search filter shows All case instances, but it can be narrowed to show only Active case instances or Completed case instances.

In addition to the case state, the following fields can be added to the filter: Instance ID, Definition key, Business key, Definition ID, and Definition name.

900 case instances

Clicking on a case instance shows the corresponding indexed document.

900A case instances

The Reindex case instances button is used to trigger a reindex.

900B case instances

Tasks

In this section, you can find all the tasks present in this Elasticsearch index.

The default search filter shows All tasks, but it can be narrowed only to show Active tasks or Completed tasks.

The default search filter also has Any scope type active but can be narrowed to show either Processes or Cases task types.

In addition to the above, the following fields can be added to the filter: Assignee, Owner, Name, Form key, Process definition key, Process definition name, Case definition key, and Case definition name.

900 tasks

Clicking on a task instance shows the corresponding indexed document.

900A tasks

The Reindex tasks button is used to trigger a reindex.

900B tasks

Users

In this section, you can find all the users present in this Elasticsearch index.

The default search filter shows All users, but the list can be narrowed to show only Active users or Inactive users.

In addition to the user filter, the following fields can be added: Type, ID, User definition name, User definition key, First name, Last name, Display name, and Email.

900 users

Clicking on a user shows the corresponding indexed document.

900A users

The Reindex users button is used to trigger a reindex.

900B users

Conversations

In this section, you can find all the conversations present in this Elasticsearch index.

The default search filter shows All conversations, but it can be narrowed to show either Active conversations or Archived conversations.

The default search filter also has Any type active but can be narrowed to show Default, Topic, Discussion, Channel, Desk, Ticket, Self, Group, or Direct.

In addition to the above, the following fields can be added to the filter: ID, External ID, Name, Description, Creator ID, and Updater ID.

900 conversations

Clicking on a conversation instance shows the indexed document.

900A conversations

The Reindex conversations + messages button is used to trigger a reindex.

900B conversations

Activities

In this section, you can trigger a reindex of the activities index by clicking the Reindex activities button.

900 activities

Housekeeping

In the Housekeeping section information about the Housekeeping Runs and creating Housekeeping Runs is available. See the Housekeeping How-To for a complete discussion of this task.

Utilities

Available from: 3.11

In the Utilities section, there are different items available that can be explored and controlled by the user.

These items are:

Utilities Menu

Platform Deployments

Available from: 3.11

By default, the platform deployment section is opened. In this section, you can find all the platform deployments that were deployed in your environment. The 'Name' and 'Tenant identifier' fields can be used to narrow down the list of deployments.

Platform Deployments

Clicking on a deployment opens a new page with detailed information about this deployment.

Platform Deployment Details

The Delete deployment button is used to delete that deployment from your environment.

Platform Deployment Details Delete

Sequence Definitions

Available from: 3.11

The second tab, Sequence definitions, presents a filtered overview of all sequence definitions that belong to the deployment you selected earlier.

Platform Deployment Sequence Definitions

It is also possible to browse through all sequence definitions across all deployments. This is done by clicking Sequence Definitions in the side panel. There are some filters in the header available to assist you in your search for a particular sequence definition.

Sequence Definitions

Clicking on a sequence definition opens a new page with detailed information about this sequence definition.

Sequence Definition Details

Query Definitions

Available from: 3.11

The third tab, Query definitions, presents a filtered overview of all query definitions that belong to the deployment you selected earlier.

Platform Deployment Query Definitions

It is also possible to browse through all query definitions across all deployments. This is done by clicking Query Definitions in the side panel. There are some filters in the header available to assist you in your search for a particular query definition.

Query Definitions

Clicking on a query definition opens a new page with detailed information about this query definition.

Query Definition Details

Variable Extractor Definitions

Available from: 3.11

The fourth tab, Variable Extractor definitions, presents a filtered overview of all variable extractor definitions that belong to the deployment you selected earlier.

Platform Deployment Variable Extractor Definitions

It is also possible to browse through all variable extractor definitions across all deployments. This is done by clicking Extractor Definitions in the side panel. There are some filters in the header available to assist you in your search for a particular variable extractor definition.

Variable Extractor Definitions

Clicking on a variable extractor definition opens a new page with detailed information about this variable extractor definition.

Variable Extractor Definition Details

Sequence Values

Available from: 3.11

Sequence Values represent the runtime values for the sequence definitions. Clicking this tab on the sequence definition page results in an overview of all sequence values related to the sequence definition.

note

The Sequence Values will contain multiple values only if the Sequence Definition is in the default tenant. Otherwise, one sequence definition has only one sequence value.

Sequence Definition Sequence Values

It is also possible to browse through all sequence values across the entire system. This is done by clicking Sequence Values in the side panel. There are some filters in the header available to assist you in your search for a particular sequence value.

Sequence Values

Clicking on a sequence value opens a new page with detailed information about this sequence value.

Sequence Value Details

A Flowable Control Admin user can also execute some actions for a particular Sequence Value.

Update Sequence Value

Available from: 3.11

Clicking the Update Value button will open a popup in which the new value for the sequence will be available.

Sequence Value Update

note

This action is only available for Flowable Control Admin users

Delete Sequence Value

Available from: 3.11

Clicking the Delete Value button will open a popup in which the deletion of the sequence value needs to be confirmed.

Sequence Value Update

note

This action is only available for Flowable Control Admin users