System Info
The System Info section exposes low-level information about the runtime environment itself — how the engine is configured, how it is behaving, and how its licensed usage compares to what you are entitled to. It is aimed at operators of a self-hosted Flowable cluster and appears only for those environments.
Every System Info view shares the same header actions: a Refresh button, a Copy JSON action, and a Download JSON action that exports the raw payload behind the current view for support tickets or offline analysis. The per-node views also offer a node selector, so you can inspect each node of a multi-node environment.
Job Info
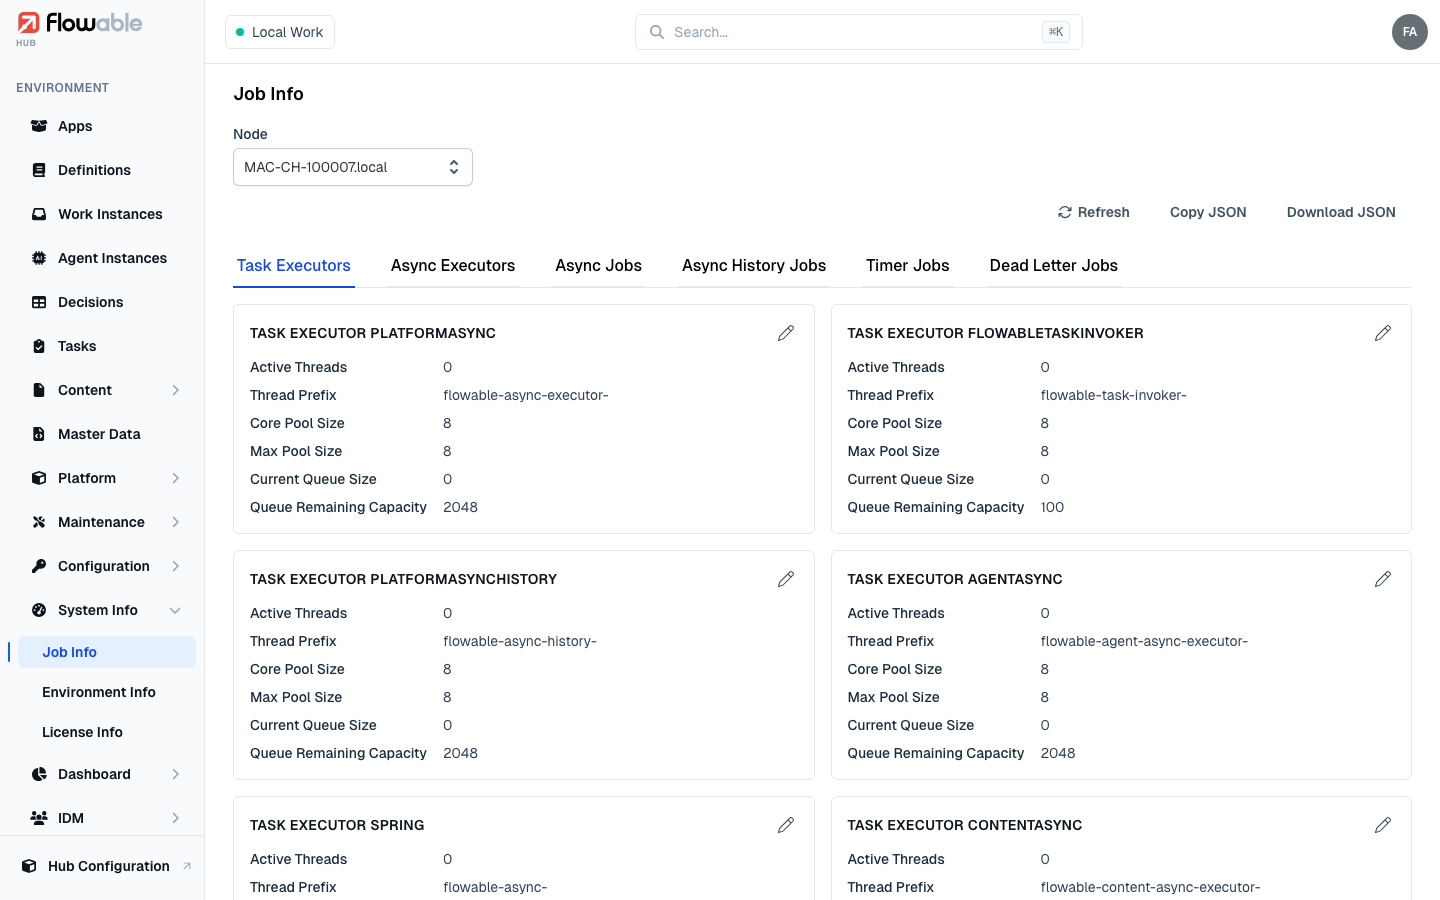
The Job Info view reports on the engine's asynchronous processing — the executors that run background work and the throughput they achieve. Per node it shows:
- Task Executors and Async Executors cards, listing each executor's active threads, core and maximum pool sizes, queue capacity, and lock settings (including the per-engine BPMN, CMMN, async-history, content and agent executors).
- Chart tabs for Async Jobs, Async History Jobs, Timer Jobs and Dead Letter Jobs, plotting acquisition and execution activity over time so you can see whether the executors are keeping up.
If you hold the edit system configuration permission (hub:configuration:system-config:update), an Edit
action on the executor cards lets you adjust the runtime executor configuration in place — useful for tuning a
live cluster.
Environment Info
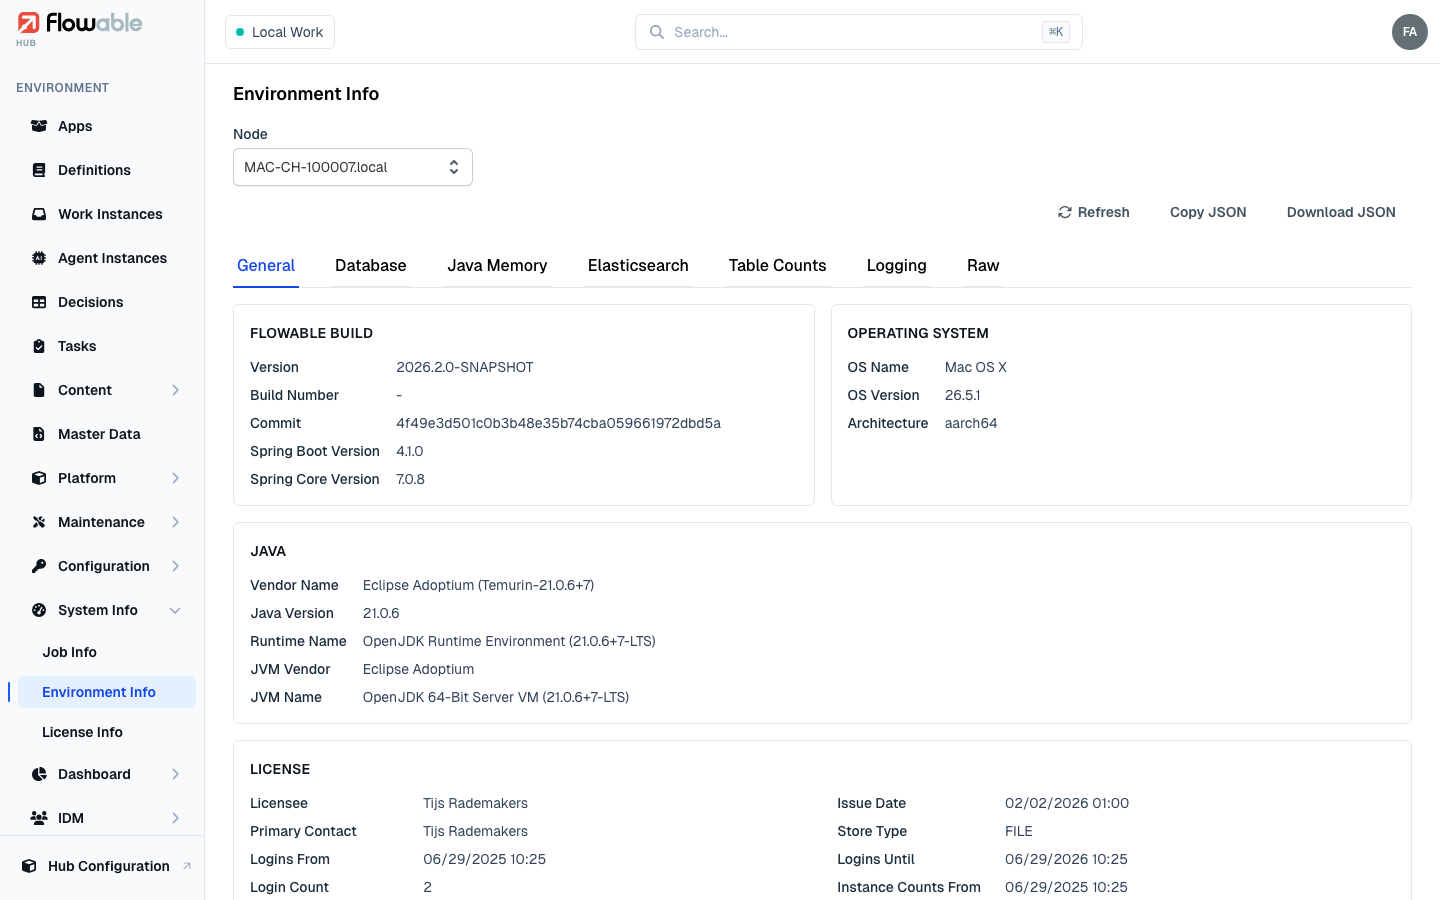
The Environment Info view is a full snapshot of the environment's configuration and platform, organized into tabs:
- General — Flowable build and version, Spring, Java and OS details, the enabled engine configurations, and a license summary.
- Database — the datasource and connection-pool configuration; with the edit permission you can adjust the connection-pool settings (Hikari/Oracle) here, with a warning that you are changing a live system.
- Java Memory — heap, non-heap and memory-pool usage.
- Elasticsearch, Table Counts and Logging — the search backend, row counts per engine table, and the active log levels.
- Raw — the complete node payload as JSON.
License Info
The License Info view is the environment's license-compliance dashboard. It tracks how the environment's
runtime usage — named and occasional users, root instances (RCPI) and agents — compares against what the
installed license entitles it to, and highlights anything that is approaching or over its limit. It is separate
from the Hub application's own license, which is managed under
Hub Configuration → License. Viewing it requires the hub:info:license:read
permission.
The figures are aggregated across the whole cluster, so this view has no per-node selector. Its header carries the
standard Refresh, Copy JSON and Download JSON actions — the last two export the complete compliance
report (the full license-info payload, including the validation details) — alongside a row of controls:
- Period selects the reporting window the figures are calculated over.
- Compare with optionally picks a second period, so each metric can show how usage has moved (▲ / ▼) between the two.
- Occasional-user threshold (login days) sets how many active days separate a named user from an occasional one — the definition that drives the user counts below. It defaults to the threshold carried in the license, or 12 login-days when the license does not specify one.
- Anonymize users replaces user identifiers with hashes in both the on-screen tables and the export, for sharing without exposing who is who.
When the license is nearing its end date, an expiry countdown banner appears above the tabs — amber from 90 days out ("License expires in N days"), turning red within the final 30 days and once the license has expired.
The report is organized into six tabs.
Overview
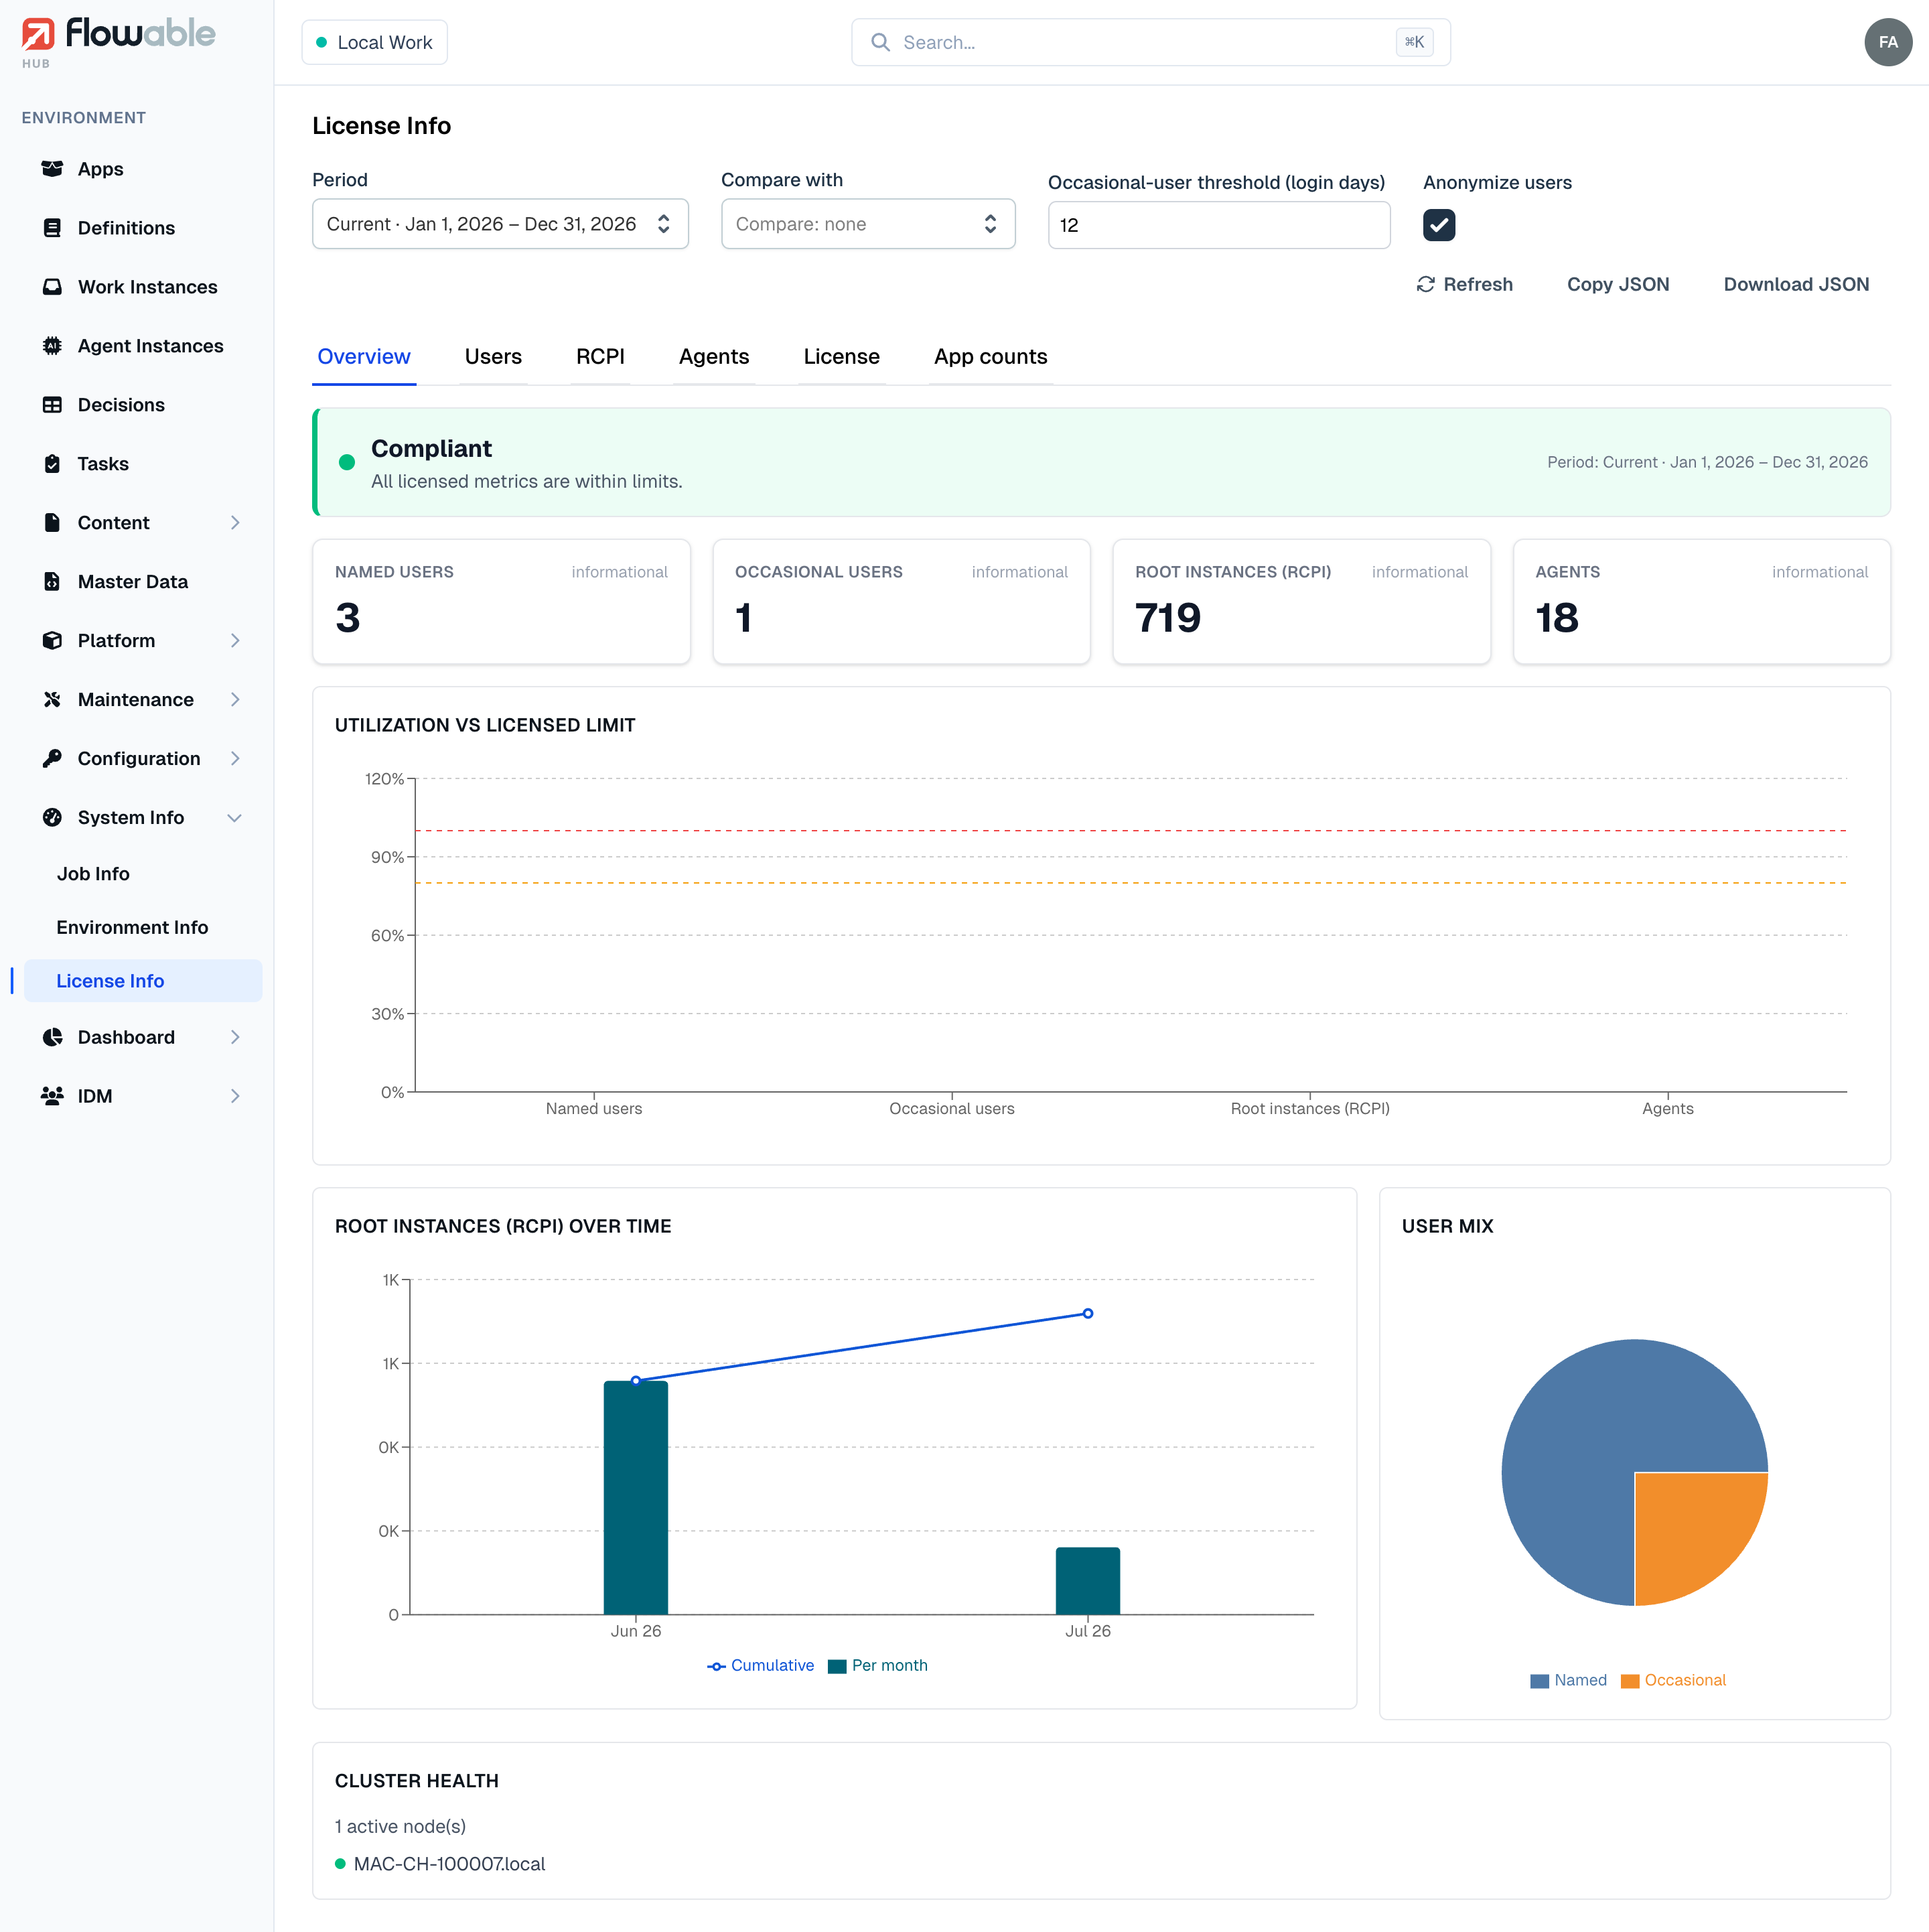
The Overview tab is the at-a-glance compliance summary for the selected period. It opens with a verdict banner giving the environment's overall state:
- Compliant — all licensed metrics are within limits.
- Approaching — one or more metrics are near their licensed limit.
- Over — one or more metrics exceed the limit and action is required.
Below it, a meter card for each licensed metric — Named users, Occasional users, Root instances (RCPI) and Agents — shows the value used, the licensed limit, a status chip, and a progress bar with a marker at 80%; with a compare period selected it also shows the change against it. The colour follows a simple rule: usage below 80% of the limit is compliant (green), from 80% up to the limit is approaching (amber), and at or above the limit is over (red); the banner reflects the worst metric. A metric with no licensed limit is shown for information only, marked informational and without a state.
Three charts and a status card round out the tab: Utilization vs licensed limit (each metric as a percentage of its limit), Root instances (RCPI) over time (per-month bars with a cumulative line), a User mix pie (named versus occasional) and a Cluster health card listing the active nodes.
Users
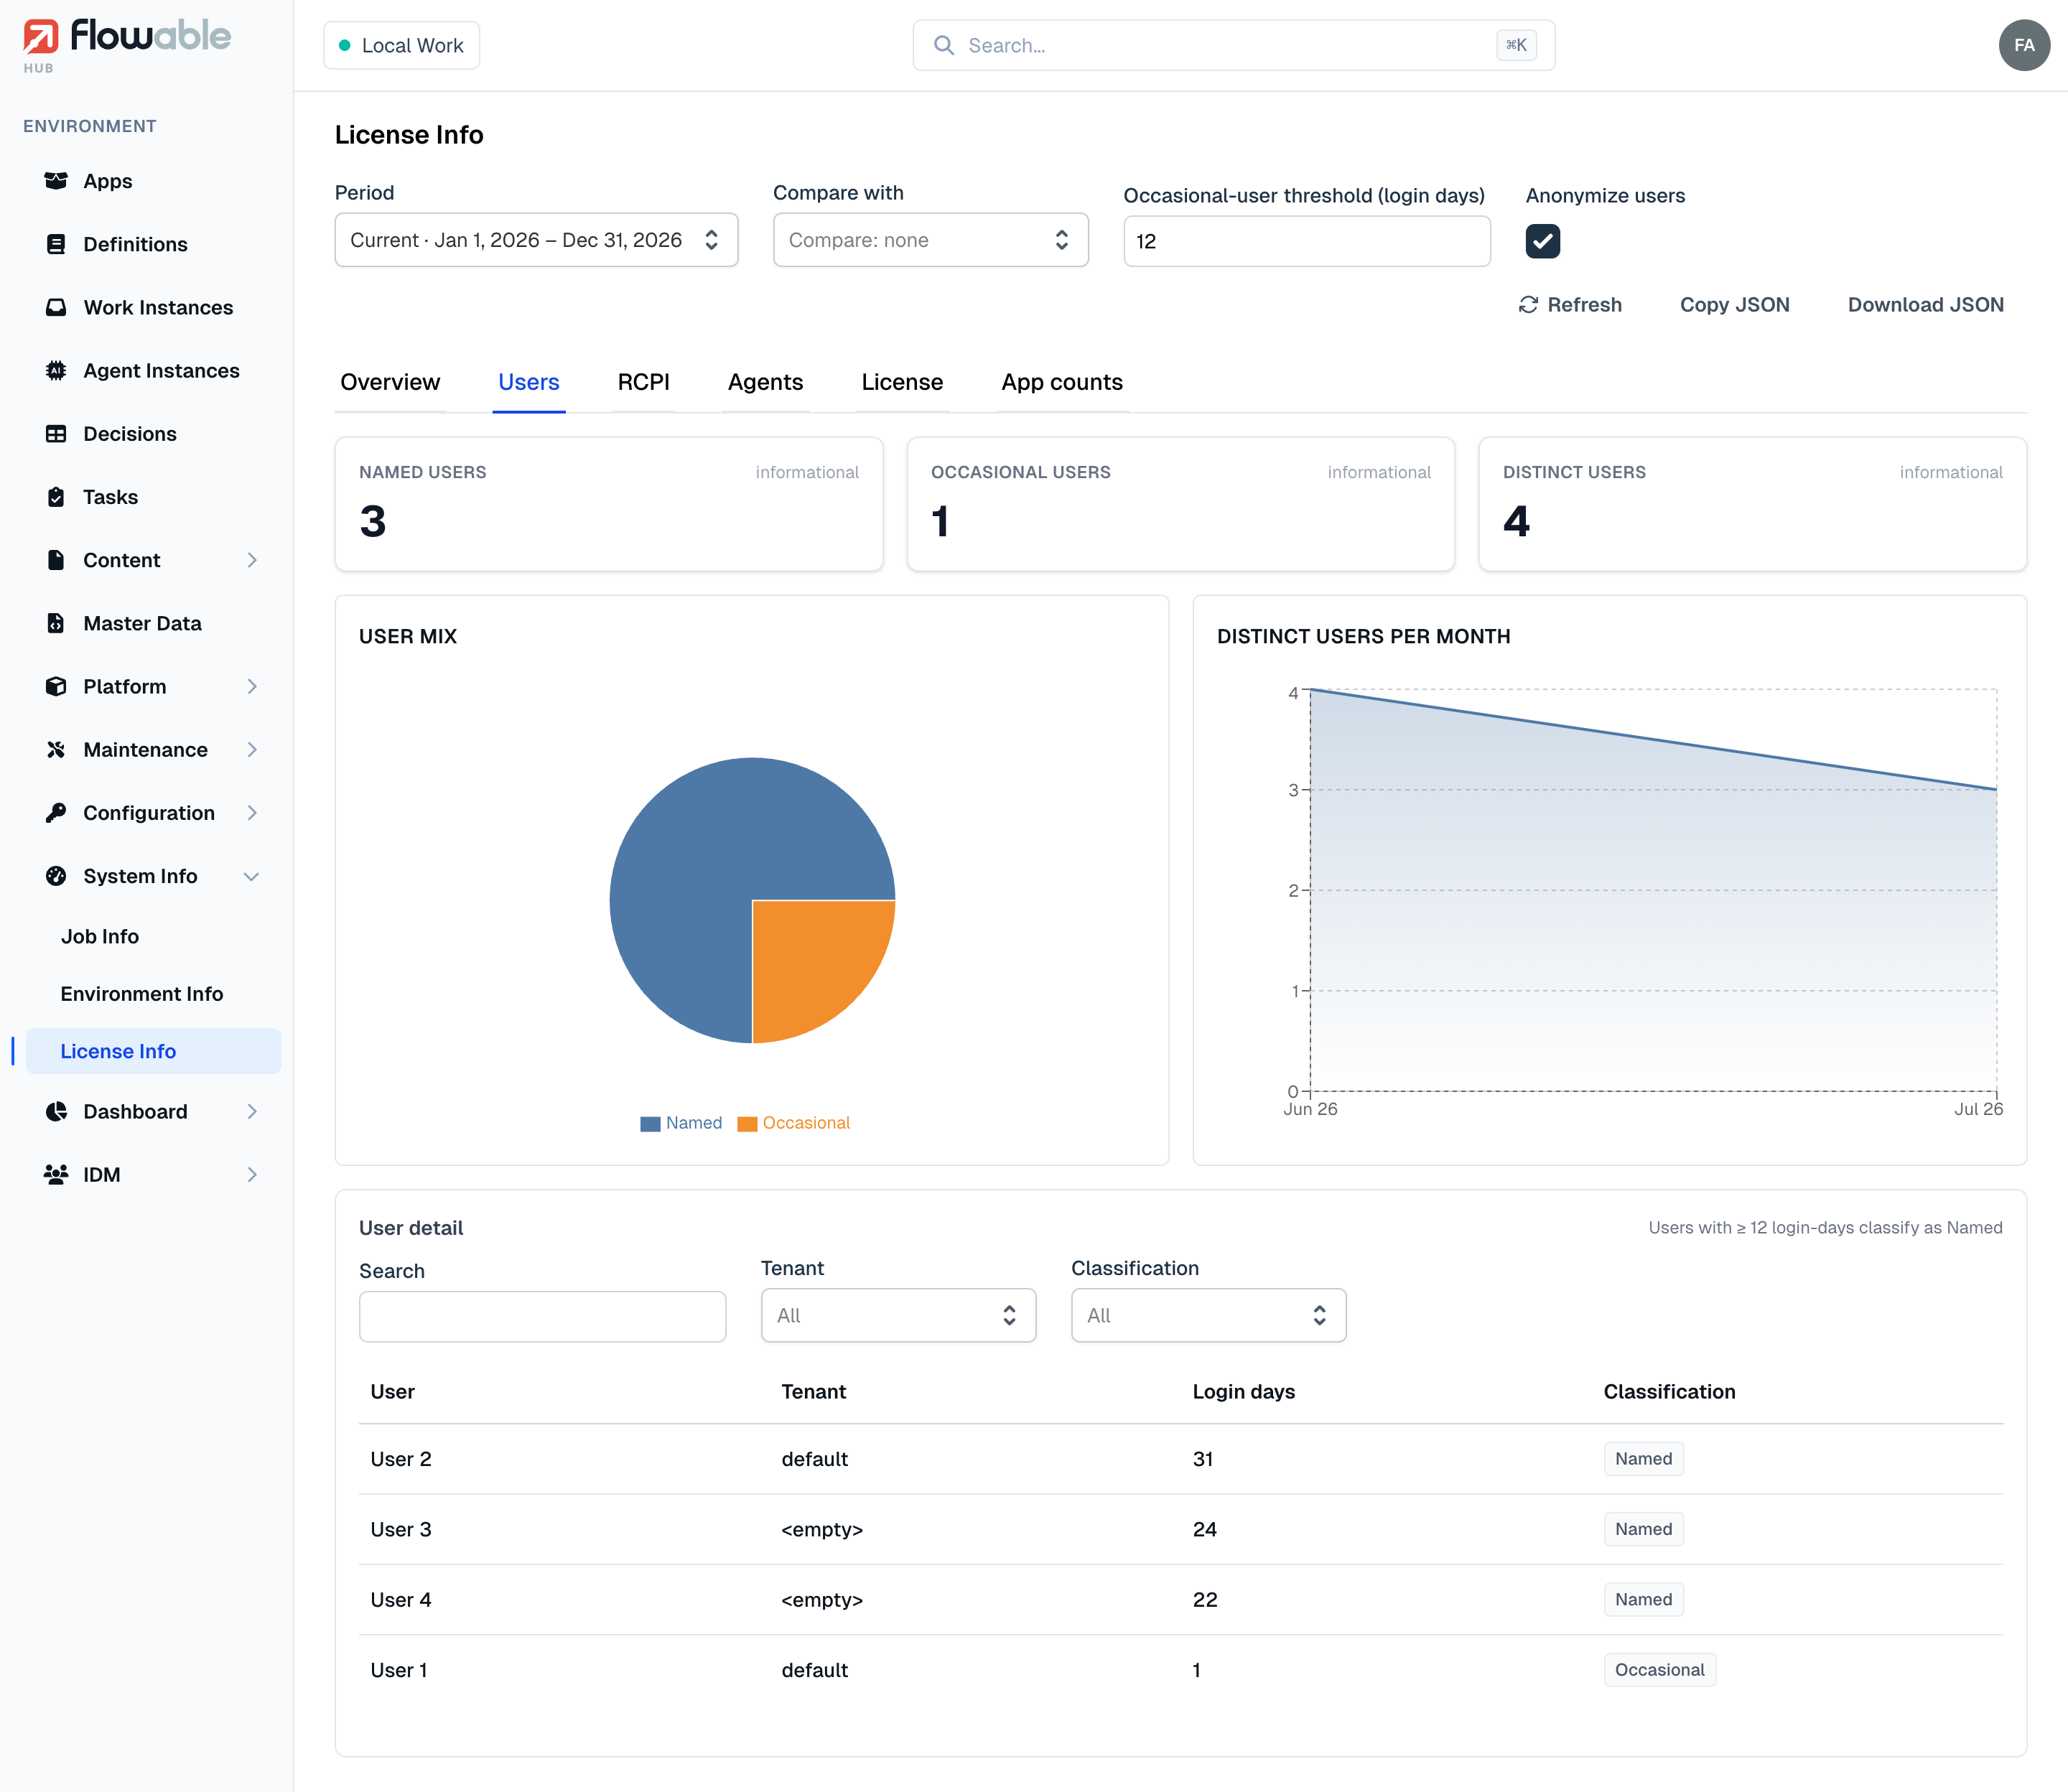
The Users tab breaks down who is consuming user entitlements. Meter cards show Named (regular), Occasional and total Distinct users, followed by a User mix pie and a Distinct users per month trend. The User detail table lists one row per user — User, Tenant, Login days and a Classification badge (Named or Occasional) — sorted by login days, with search, tenant and classification filters and a reminder that users with at least the threshold number of login-days count as Named. With Anonymize users enabled, the identifiers are masked (User 1, User 2, …).
RCPI
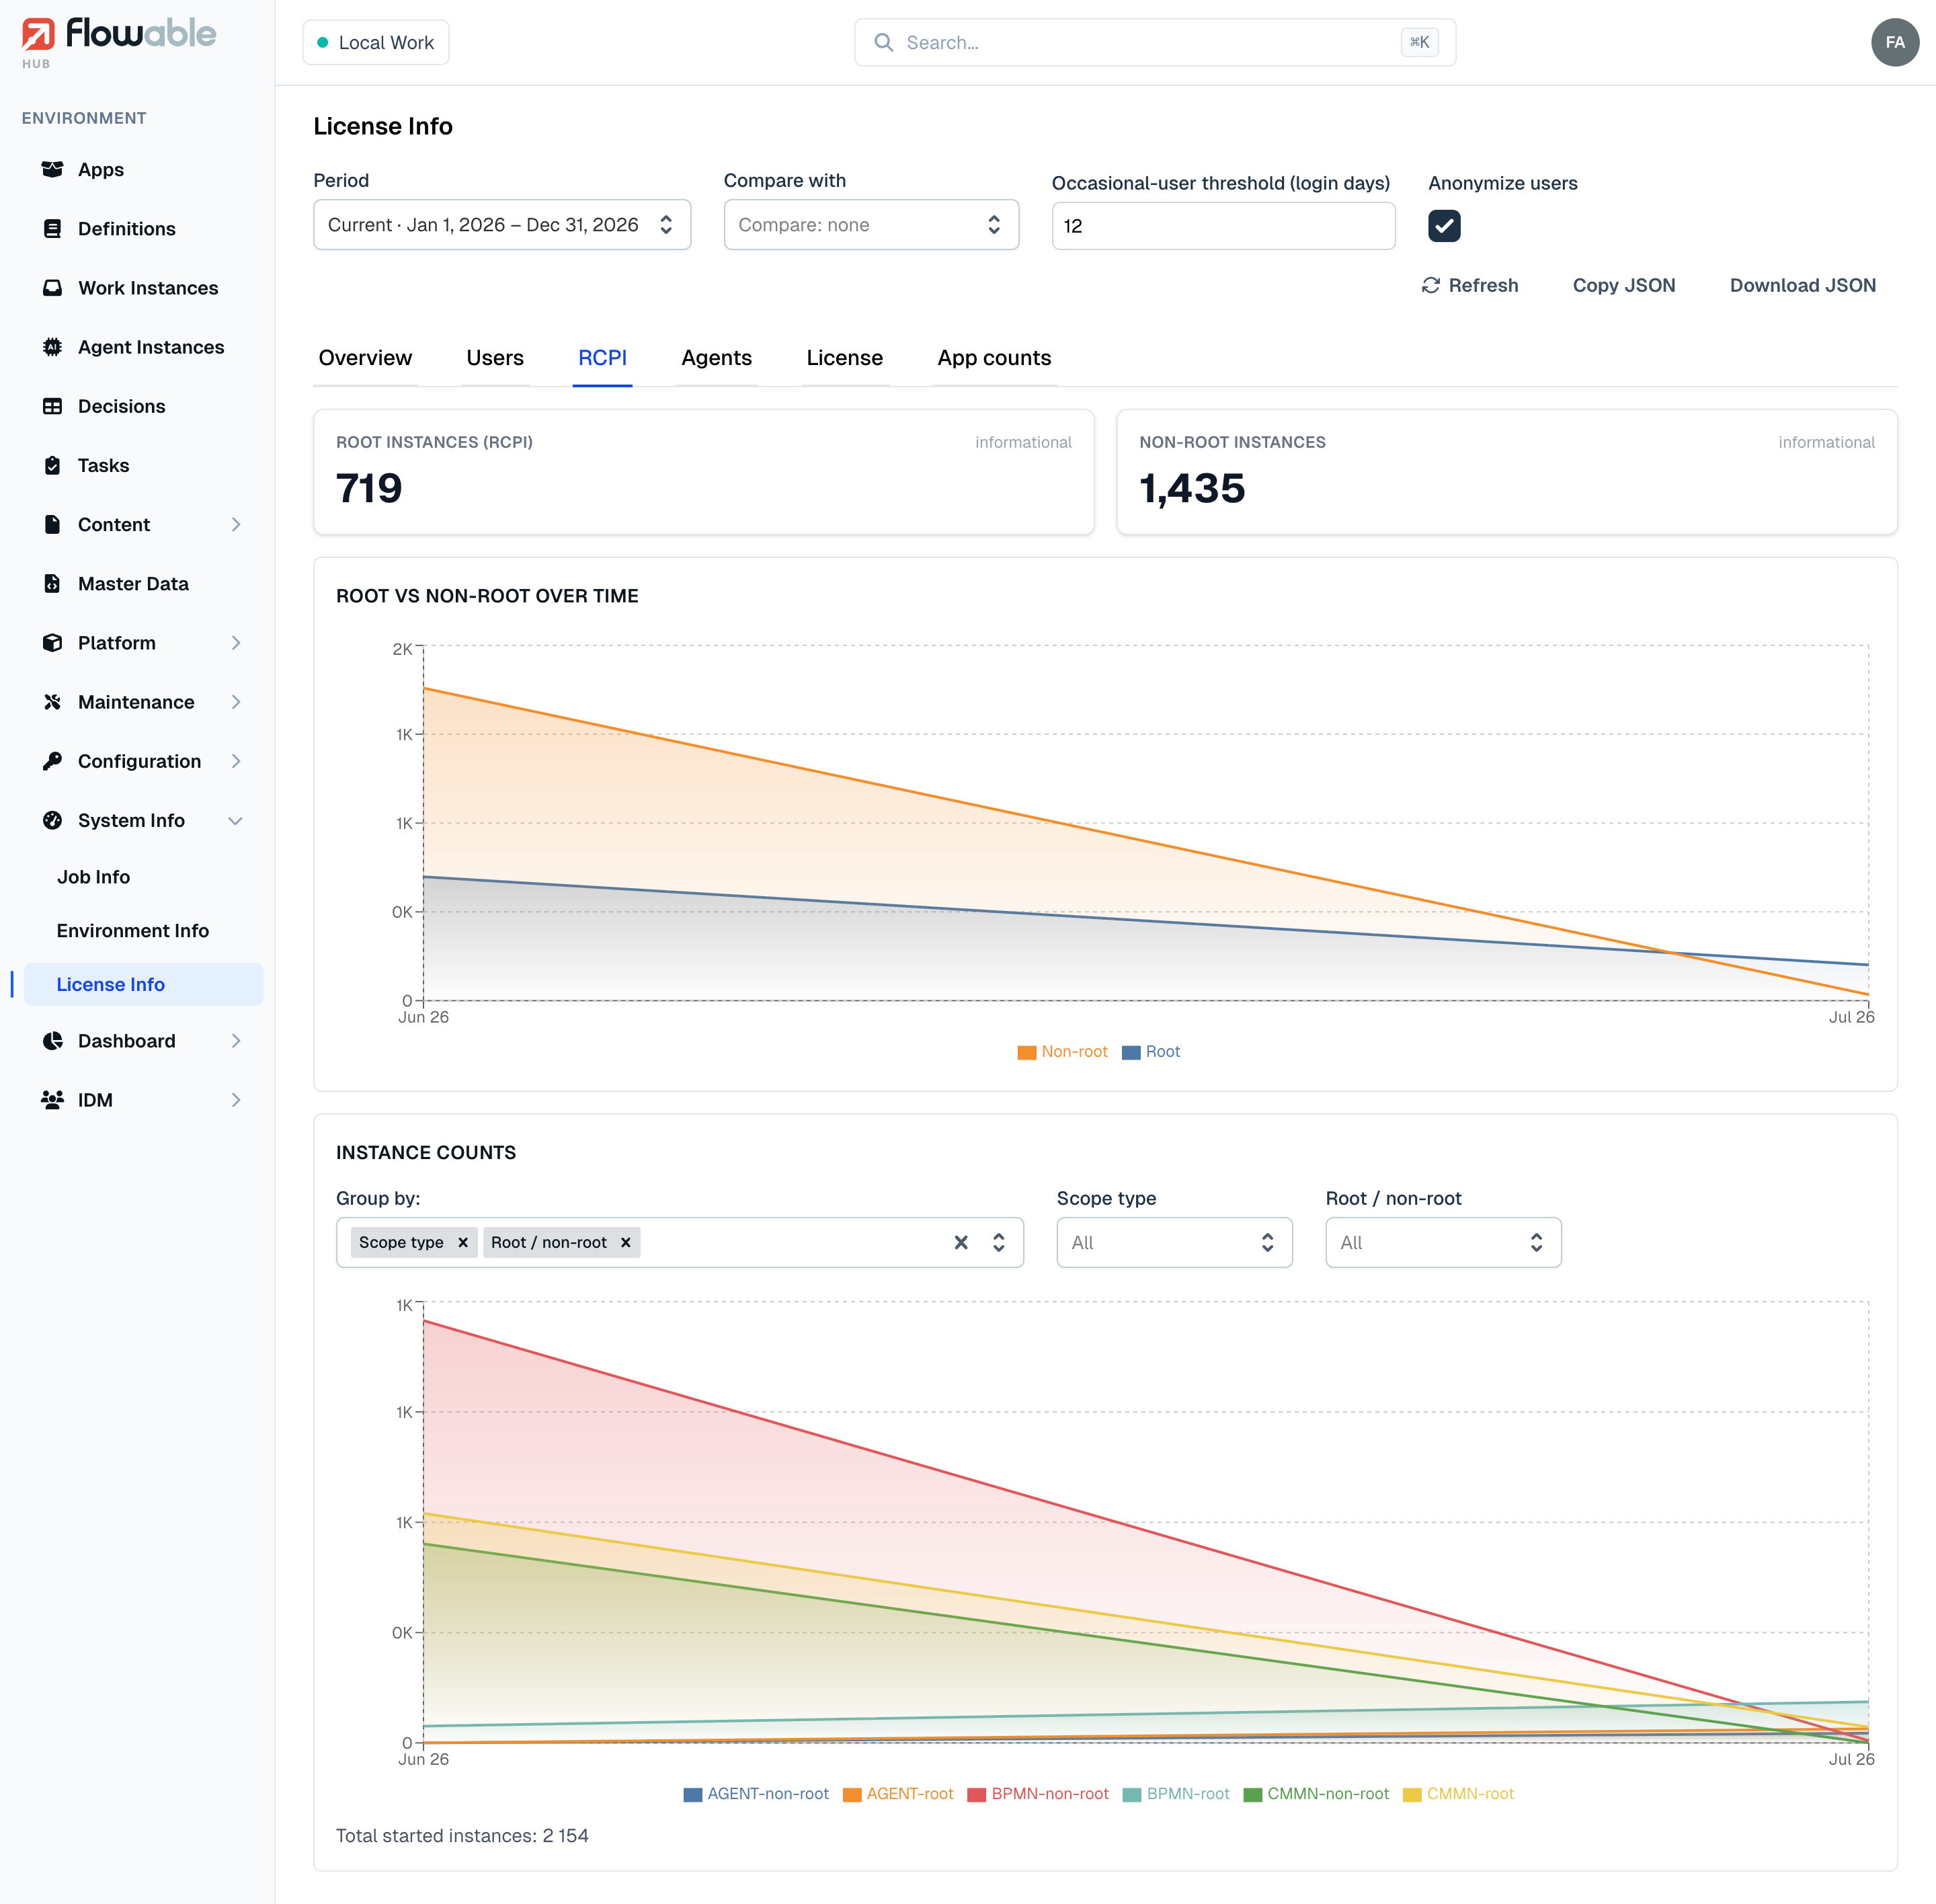
The RCPI tab details root case-and-process instance consumption — the instance metric the license counts. A Root instances (RCPI) meter (measured against the limit) sits beside an informational Non-root instances meter, above a Root vs non-root over time chart. The Instance counts card plots started instances over time and can be grouped by tenant, scope type or root/non-root — with matching filters — and reports the total started instances below the chart.
Agents
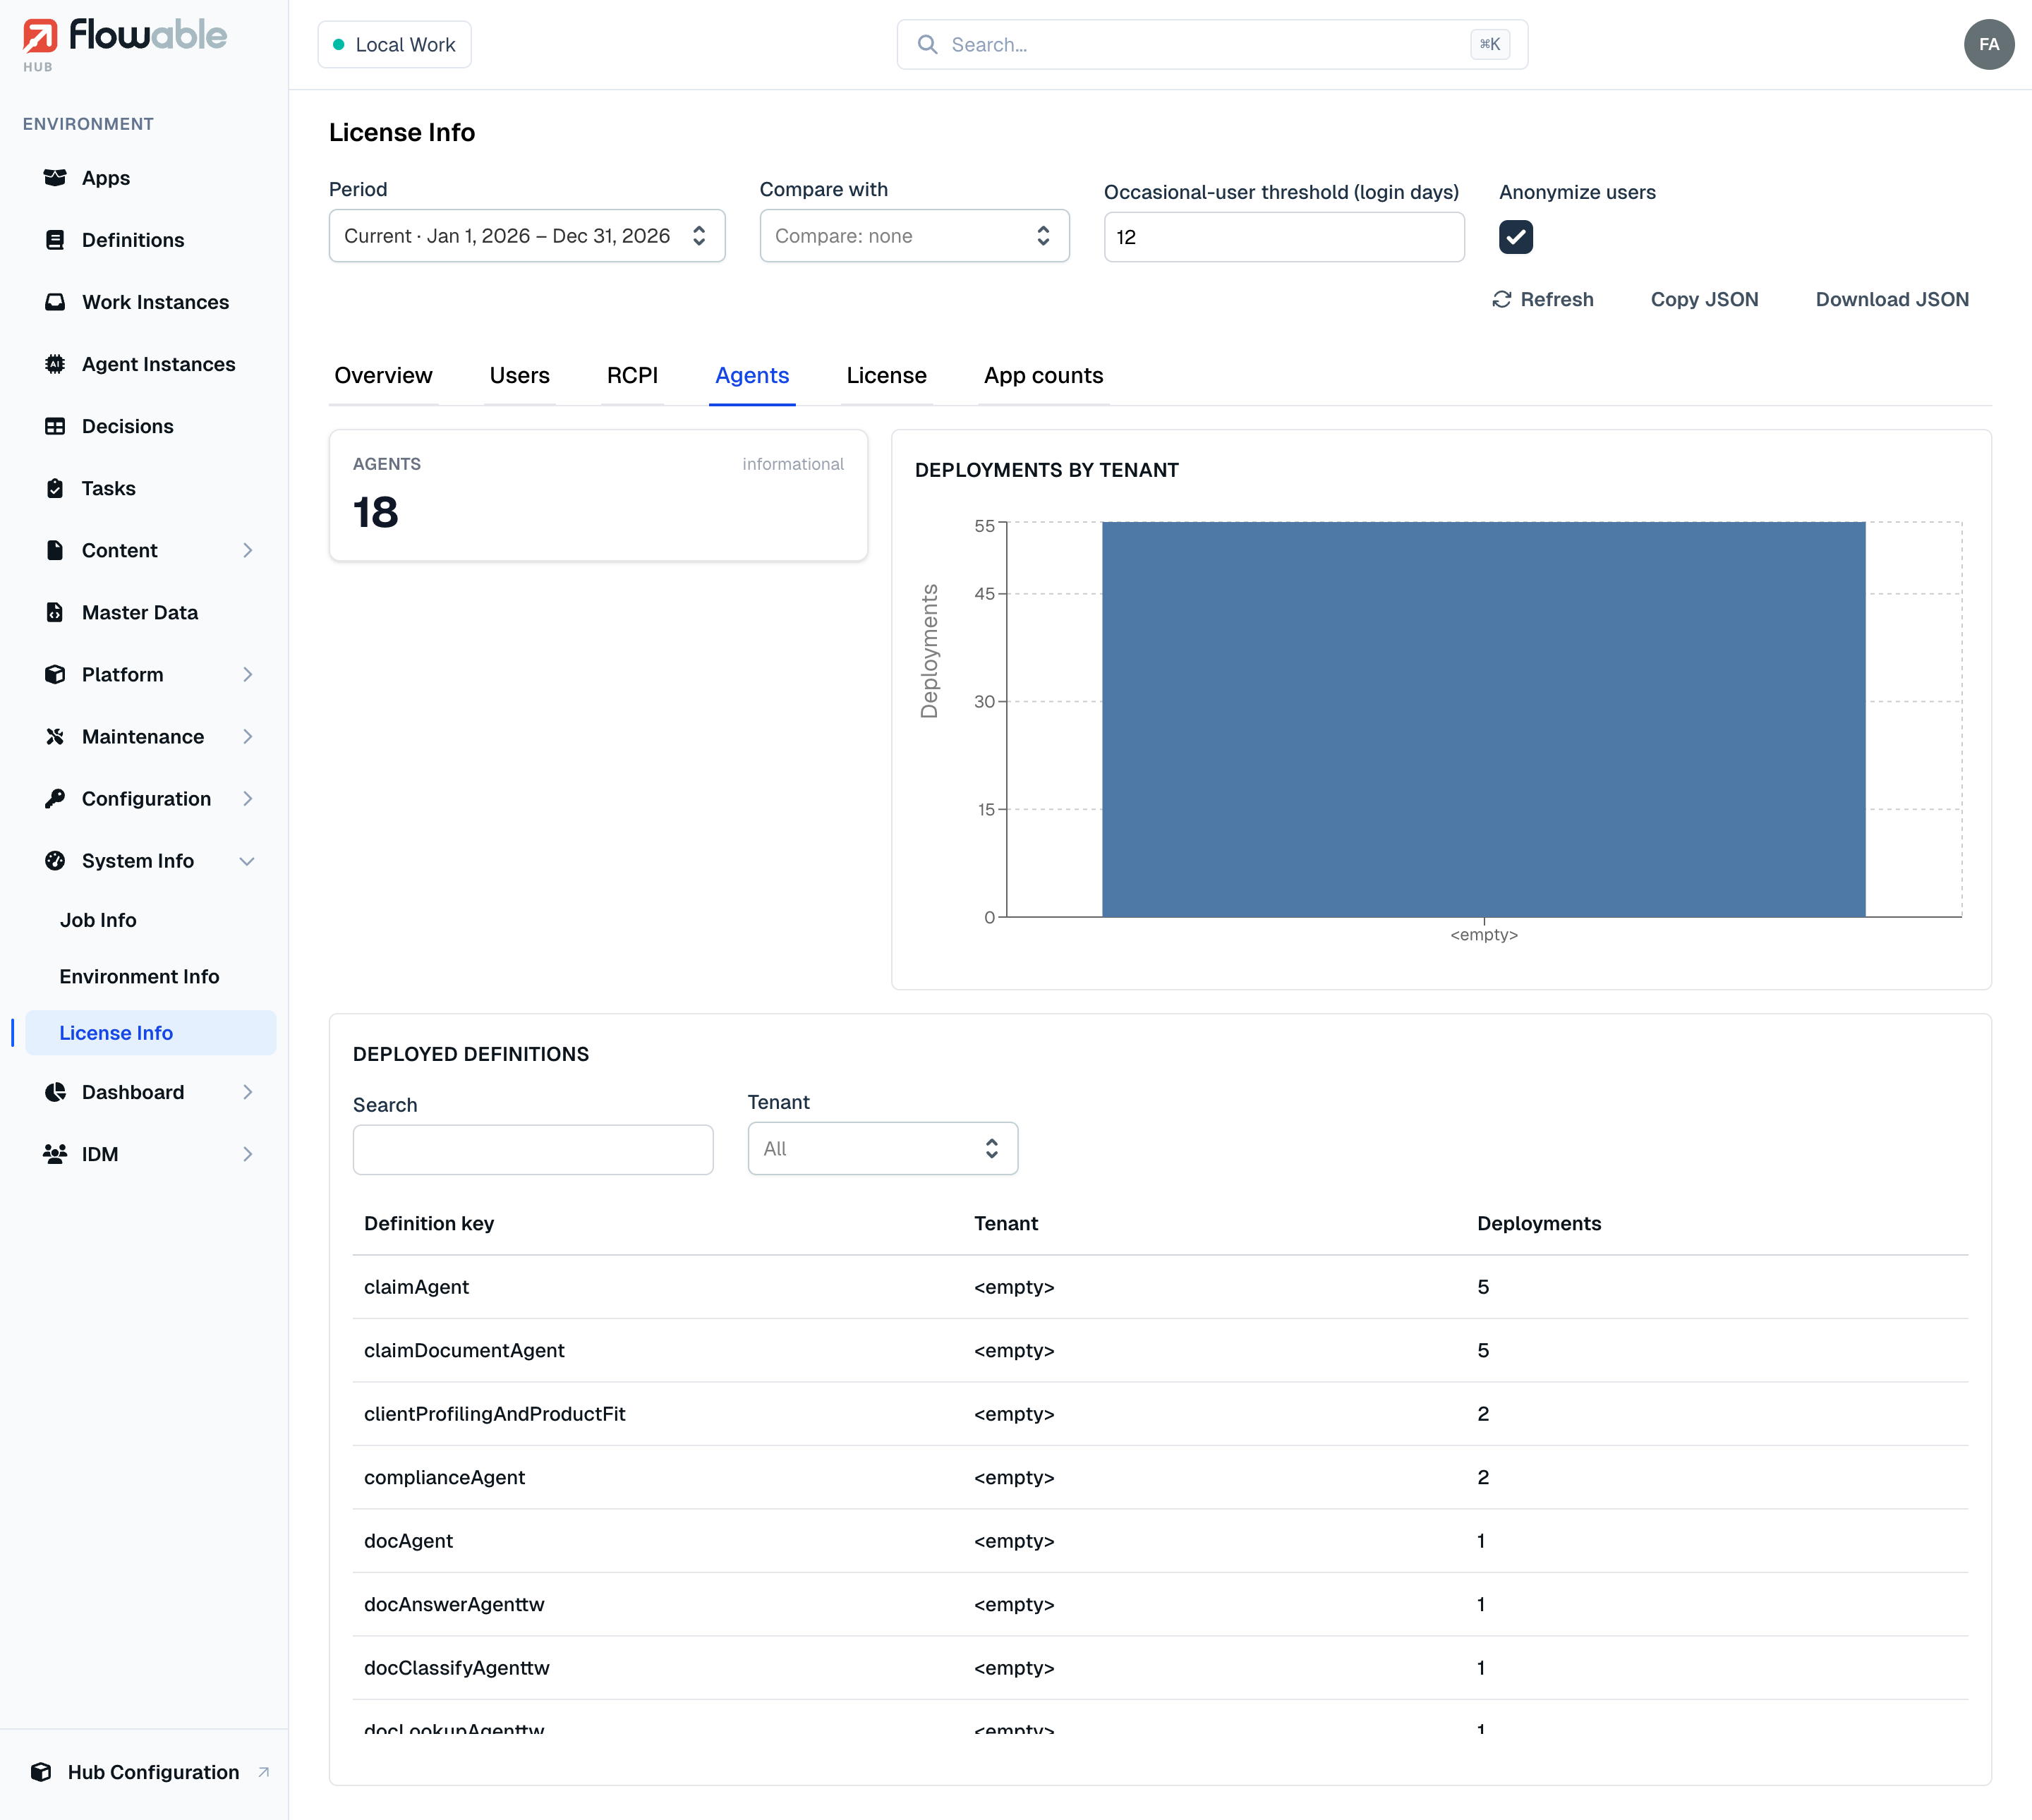
The Agents tab covers deployed agent definitions. An Agents meter (deployed against the limit) sits next to a Deployments by tenant bar chart, above a Deployed definitions table listing each agent's Definition key, Tenant and number of Deployments, with search and tenant filters.
License
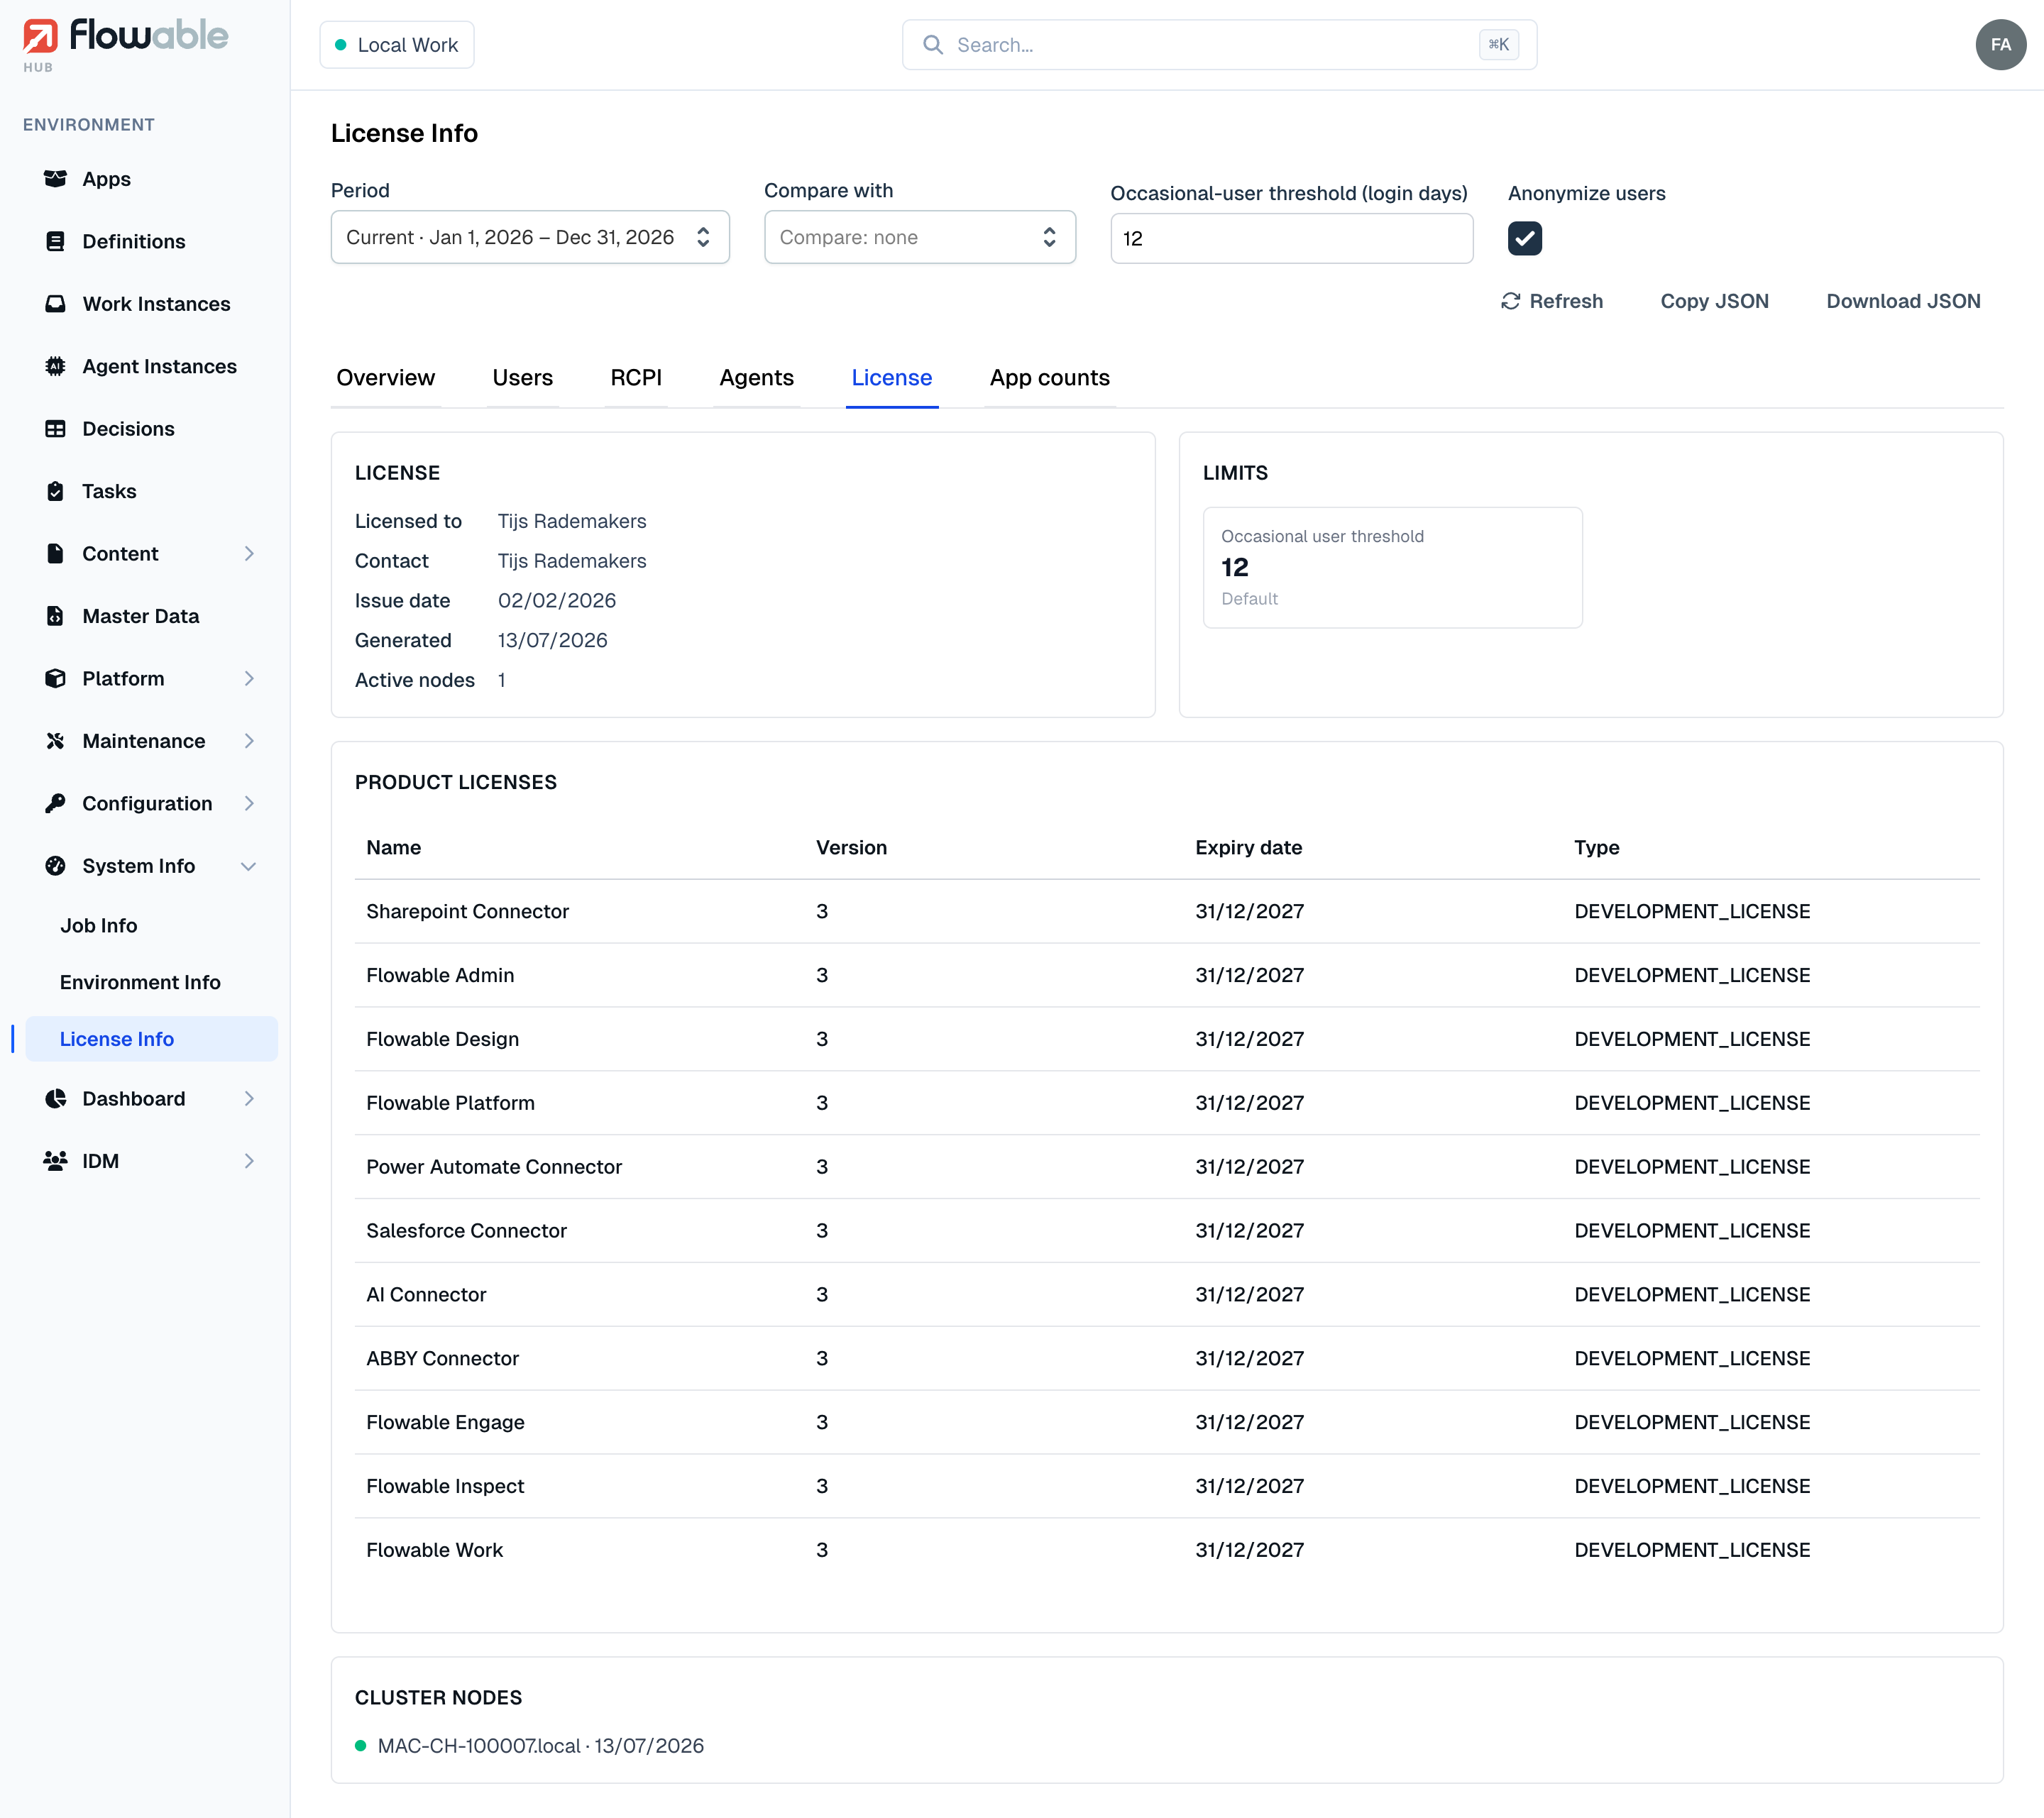
The License tab shows the entitlement behind the numbers. A License summary card lists the licensee, contact, issue date, the report's generation timestamp and the active-node count; a Limits card shows a tile per licensed metric plus the Occasional user threshold in effect (labelled From license or Default). A Product licenses table (Name, Version, Expiry date, Type) and a Cluster nodes card with each node's last-active time complete the tab.
App counts
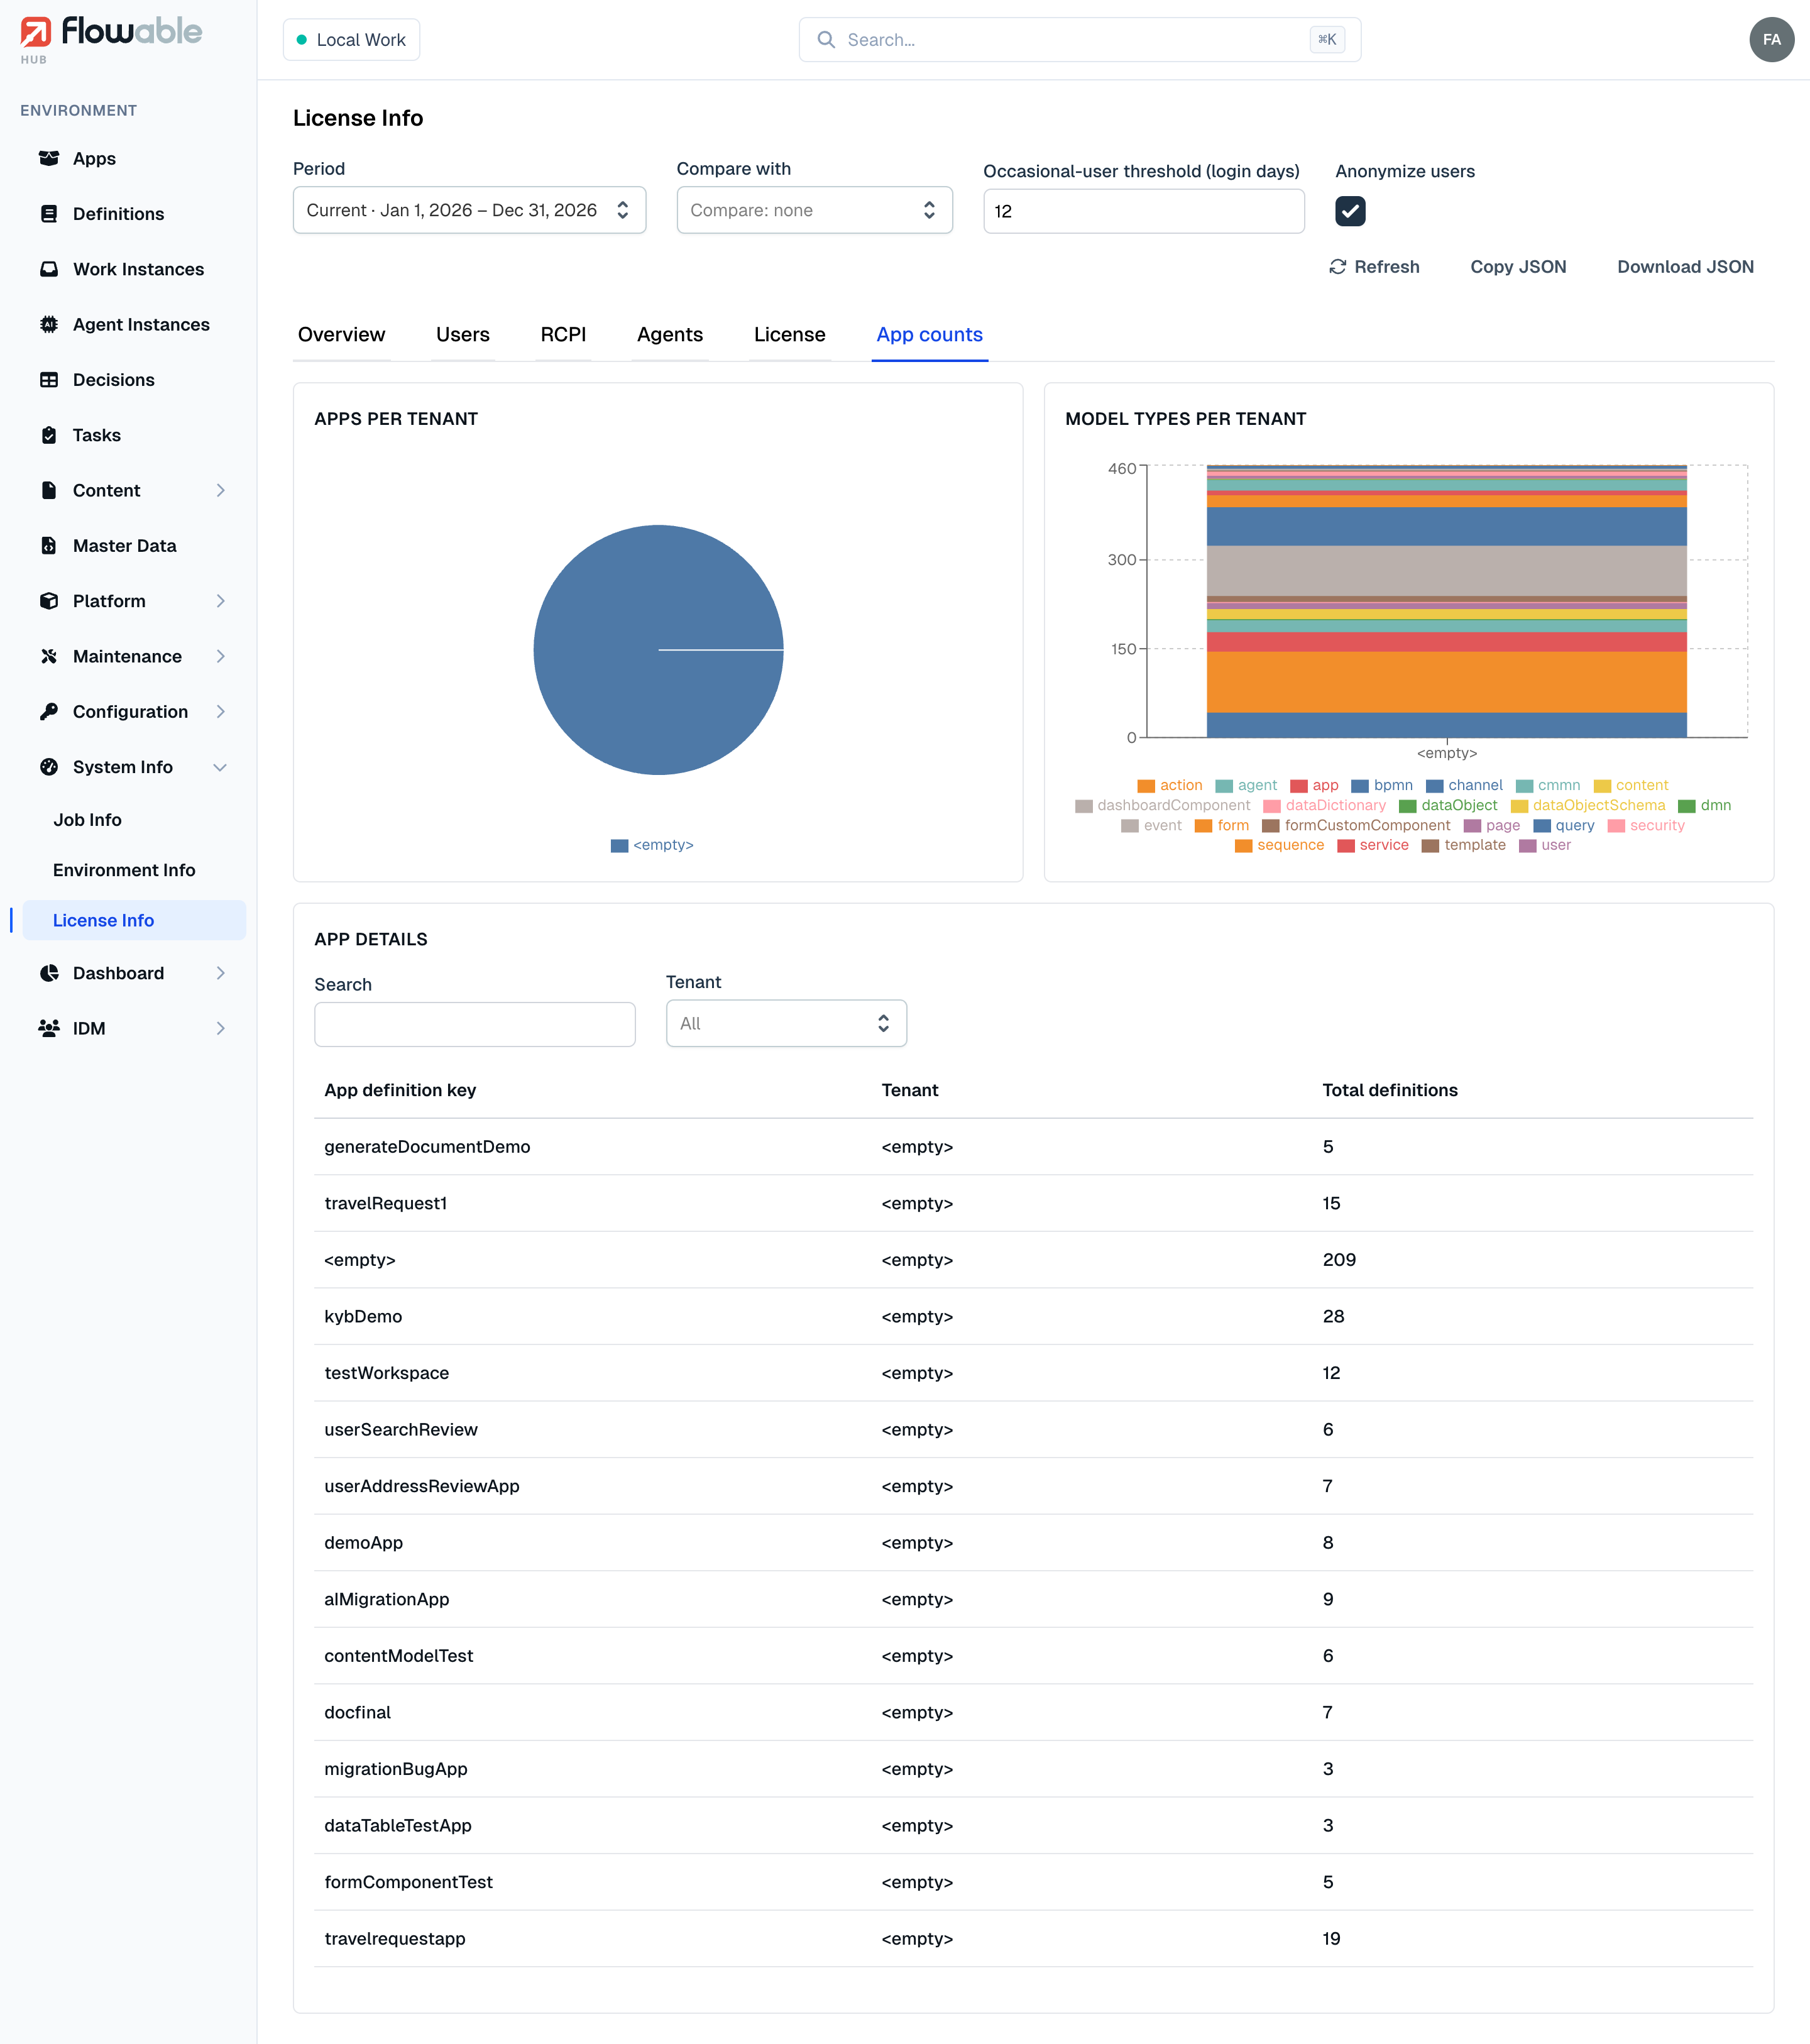
The App counts tab reports the deployed model footprint: an Apps per tenant pie, a Model types per tenant stacked bar (one segment per definition type) and an App details table listing each App definition key, its Tenant and the Total definitions it contains, with search and tenant filters.
When an environment exceeds its licensed capacity, Flowable Work also shows a persistent banner to everyone who uses it — "Your system has exceeded its licensed capacity" — listing each exceeded metric and how far over it is, so over-use is visible even to people who never open Hub. Administrators get a Manage license shortcut from the banner. A system with no valid license shows a similar "No valid license found" banner instead.