Basic Performance Tuning
Target audience: System administrators & developers
All the Flowable engines have been designed with performance and scalability in mind. All engines are 'stateless', in the sense that any engine (API or REST API) can take on any requests and thus multiple nodes can be set up to scale when scaling is needed.
Tuning Flowable applications, whether Flowable Orchestrate, Work, Engage or a custom application with the engines embedded depends on many factors. For example, having one service task in a process or case model that gets either executed a lot or takes a long time to complete could impact the performance of the whole system when not implemented properly. As with any software solution, monitoring of production systems is advised when it comes to the usage of cpu, memory, disk or network traffic.
Nevertheless, there are some basic configuration settings that can be generally applied when it comes to tune Flowable installations. In this guide, we'll describe and discuss these options.
System Resources
All Flowable products run on a Java JVM (Java virtual machine). Although Flowable has been designed with minimal resource usage (CPU / memory) in mind, provisioning better and more server resources always helps. Simply put: a better CPU will typically improve performance, as will giving more memory to the application.
Standard JVM settings apply here. Please refer to the JDK vendor documentation for specific configuration options. For example (on any JVM type), giving more memory can be done with the Xms (initial memory) and Xmx (maximum memory) settings:
java -Xms1g -Xmx8g ...
(the example above would give the JVM maximum 8 gigabytes of memory)
 note
noteAlternatively resources can be specified relative to the available system memory.
Instead of using -Xms and -Xmx you can use -XX:MaxRAMPercentage to specify the maximum size of the heap as percentage of the available system memory.
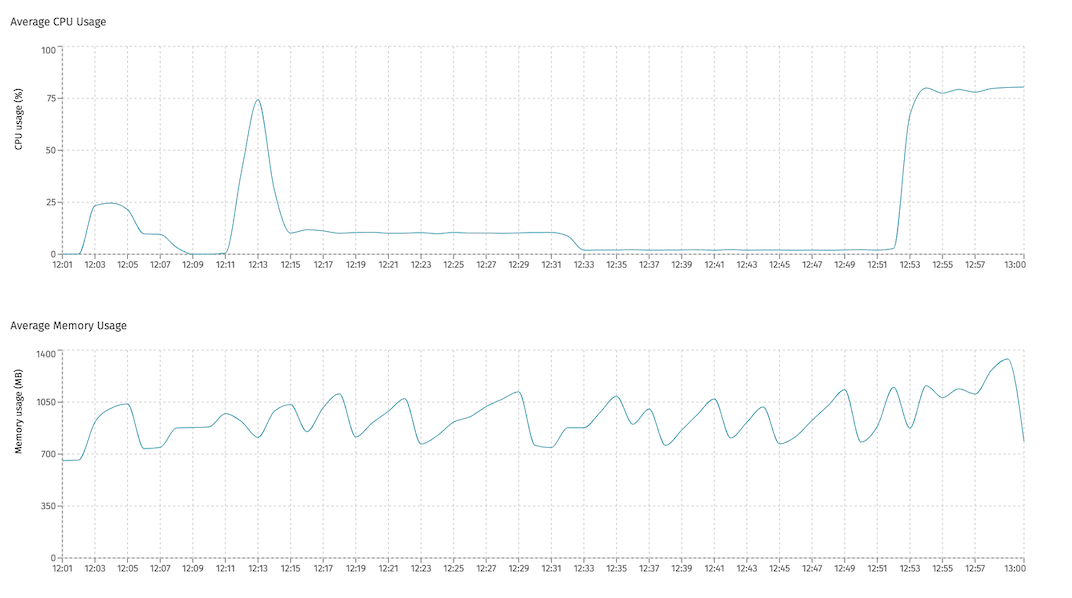
In Flowable Control (when metrics are enabled), the CPU and memory usage of each node in a Flowable cluster can be seen.
Database
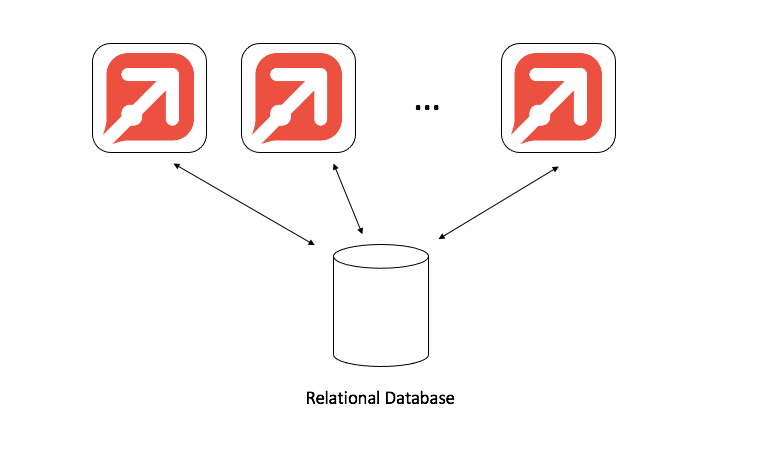
The most important component with regards to performance when running any Flowable product is the relational database. All runtime and historical data is stored in this database and the nature of ACID transactions are crucial to the correct functionality of many features.
Giving the database more resources (CPU, RAM or networking capabilities) is a way to typically improve Flowable's performance noticeably. Please check your database system documentation how to do this.
Secondly, check the isolation level of your database. Flowable has been designed with the 'Read Committed' isolation level in mind. Any isolation above that (repeatable read or serializable) is unnecessary and will have a negative impact on performance, as the database will need to do more work than needed. The exception to that rule is (Azure) SQL Server , check the specific details for these database systems further down below.
Every Flowable instance (whether it is Orchestrate, Work or Engage) will make connections to the database through a connection pool. Creating a connection to the database is (relatively seen) an expensive operation. The connection pool will keep connections ready for subsequent usages (or close them again if there's no need). The connection pool has a 'maximum connections' setting that, once all connections are being used, will avoid creating new connections. The incoming request for a connection will be stalled until a connection becomes available again. This means that when the number of concurrent users or asynchronous work rises, the need for database connections goes up too.
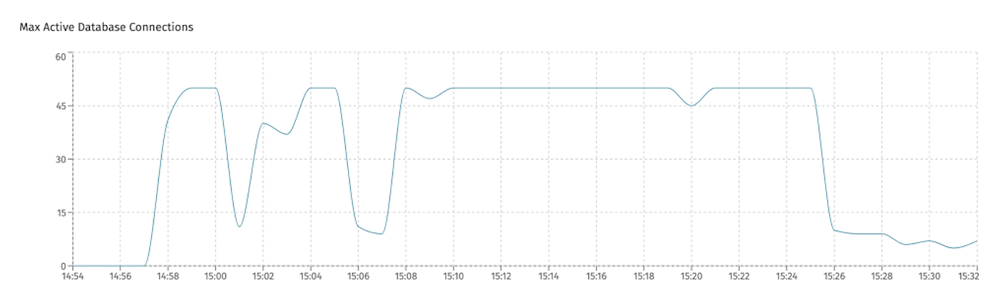
Slowdowns can happen when the connection pool is maxed out. This can be seen in the monitoring tools of the database system or in Flowable Control (if running with metrics enabled). For example, in the screenshot below, the maximum connections was set to 50, and the chart shows that all connections were being used constantly, which is a clear indication of congestion:
The minimum and maximum number of connections in the connection pool is configured with following properties. The minimum number is the number of connections that will always be kept ready, even if there's no need for it (keeping in mind creating a connection is expensive).
spring.datasource.hikari.minimumIdle=10
spring.datasource.hikari.maximumPoolSize=200
(Azure) SQL Server
When using any of the supported Microsoft SQL Server versions or Azure SQL Server as relational database with Flowable, there are two additional important considerations to be made compared to the other database systems.
Sometimes, under heavy load, a SQL Server database might give a deadlock error. This doesn't mean the transactions are necessarily waiting forever on each other, but that the database server is unable to cope with the load and elects certain transactions to be cancelled to free up the system. Applying both options described below should improve the deadlock problems.
READ_COMMITTED_SNAPSHOT Isolation level
The default isolation level of SQL server is Read Committed. With this isolation level, shared locks are used to avoid that transactions modify data in rows that one or more transactions touch during their execution. These shared locks (implemented using row, page or table locks depending on the situation) also block read operations.
In the Read Committed Snapshot isolation level, rows are versioned and a copy of rows during the lifetime of the transaction are kept (hence the 'snapshot' in the name). Our benchmarks have shown that using Read Committed Snapshot instead of the default Read Committed generally leads to better overall performance **and we advise to use Read Committed Snapshot as isolation level.
As the Flowable data layer logic uses both transaction-based data caching and optimistic locking, this fits Read Committed Snapshot nicely. The downside of this isolation level is a slightly higher disk space usage, but the performance benefits outweigh this downside.
The default isolation level of Azure SQLServer is already Read Committed Snapshot, however make sure to validate this.
Use the sendStringParametersAsUnicode=false parameter in the JDBC URL
(Azure) SQL Server has various ways of storing textual data in table columns, with the varchar and nvarchar type being the most used ones. Without going into too much details, the main difference is that nvarchar can stored unicode characters and varchar can't (that's a bit of a simplification, as varchar can actually store a subset). Nvarchar columns take up more space compared to their varchar siblings. Some columns make sense to support unicode, e.g. when names of people need to be stored, others don't need it, e.g. for technical ids.
For backwards compatibility reasons, the JDBC driver for (Azure) SQL Server will send all string parameters as unicode (thus, acting if every column is nvarchar). This means that, at least from the driver's point of view, no data 'loss' happens by changing the passed in strings if they have unicode characters.
There are two potential problems with this:
- When an index is created, the index obviously takes into account the type of the column. If the wrong type is received (e.g nvarchar for a varchar column) the query planner might decide not to use an index, leading to a slow query.
- In certain cases, the query planner will do a runtime conversion between textual formats. However, we've found in benchmarks that, under heavy load, this takes up a significant amount of CPU resources of the database system.
To solve this problem, it is recommended as of version v3.16.0+ to add following parameter to the JDBC URL:
sendStringParametersAsUnicode=false
For example:
jdbc:sqlserver://server.database.windows.net:1433;database=flowable;sendStringParametersAsUnicode=false
For versions lower than 3.16.0, using sendStringParametersAsUnicode=false is also possible and it will have the benefits described above. However, some columns won't have proper unicode support. Only use it when you're absolutely sure your user won't use unicode characters in any textual fields.
Async Executor
The async executor component of Flowable is another area that can be tuned for performance. This component is responsible for executing asynchronous tasks and timers in the background (i.e. not user-facing operations). When using lots of asynchronous tasks or timers in BPMN or CMMN models, the default settings of the async executor component of Flowable could be insufficient to cover the load.
The async executor, from a high-level point of view, does two things:
- acquire new jobs from the database
- put acquired jobs on an internal queue, from which threads of a threadpool take work from
In Flowable Control, the rejected jobs chart gives an indication when this queue is full. This means that more jobs have been created than jobs have been executed. Small spikes in this chart are okay, but long sustained period of job rejections indicate the async executor components settings need to be tuned:
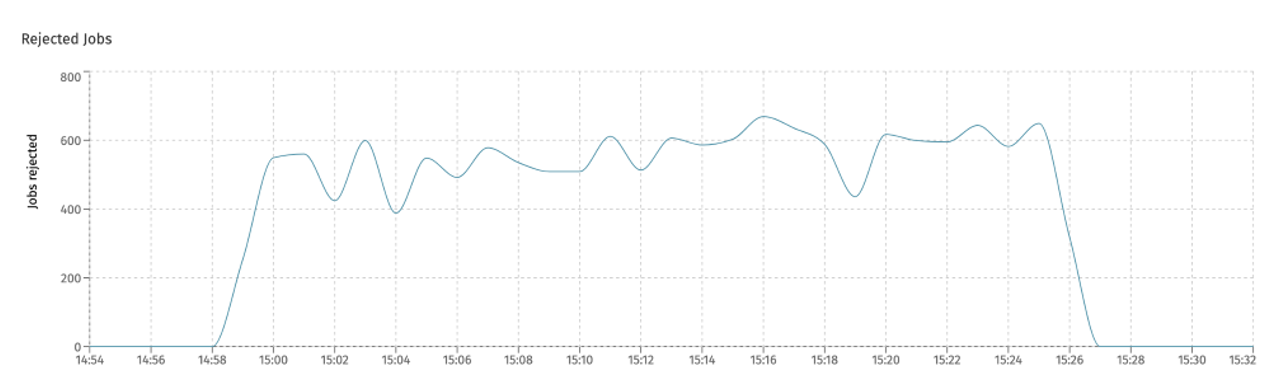
(note that this also includes history jobs, which are discussed in the next section)
Following property contains the number of jobs that are stored on the internal queue:
flowable.async-executor.thread.queue-capacity=256
Note that making this queue size too large, might keep jobs too long in the queue. Jobs that have been acquired should (by default) be executed within 5 minutes, before async executors of other Flowable nodes will start to acquire them.
The number of threads available for asynchronous execution of work, is set with following properties (by default the value is 8):
flowable.async-executor.thread.core-pool-size=32
flowable.async-executor.thread.max-pool-size=32
When using a higher number for these properties, do take into account that each one of these background threads needs a database connection. Make sure to enlarge the connection pool accordingly, like described above.
The size of the threadpool can be seen in Flowable Control (when metrics are enabled), which gives an indication whether or not the maximum number of threads is reached:
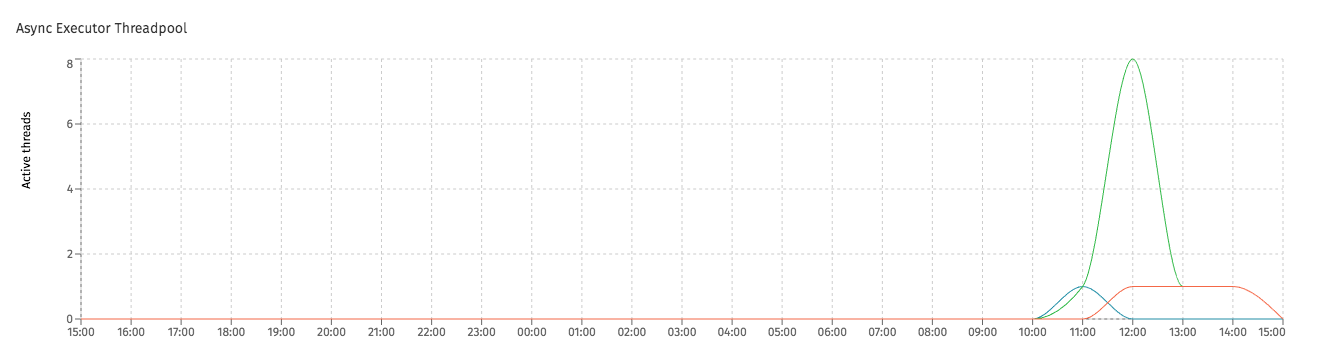
Note that this threadpool will automatically scale up and down, depending on load. Use the same number for both properties, the threadpool will actually scale down to 0 when there is no work (the name 'core' doesn't mean minimum here, like in the sense of database connection pooling - it's an internal JDK setting).
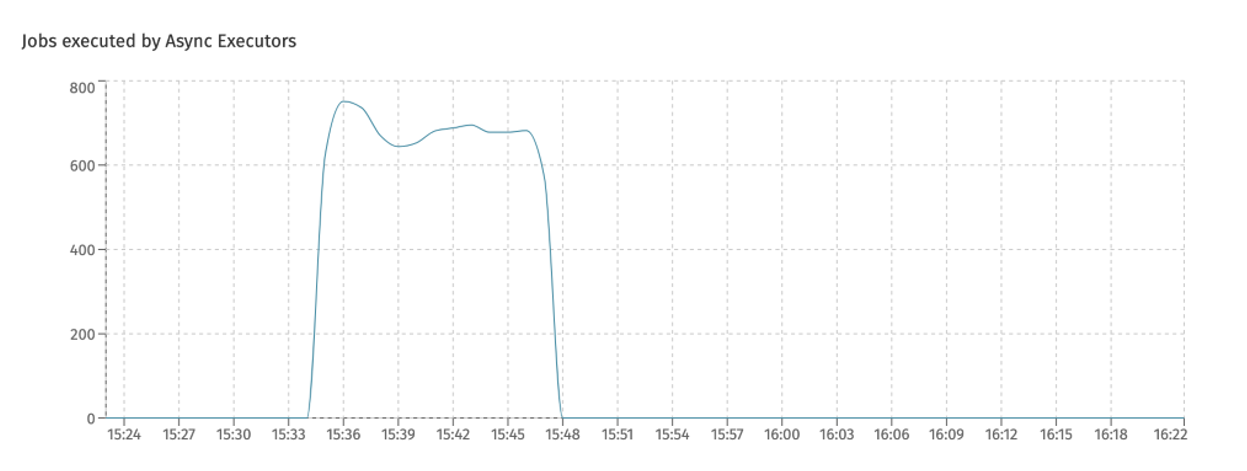
The amount of jobs that are executed by each Flowable async executor can be seen in Flowable Control (when metrics are enabled):
Indexing
Note
This part is only applicable to Flowable Work/Engage
In Flowable Work/Engage, data is indexed in Elasticsearch (https://www.elastic.co/elastic-stack) for querying, searching and building dashboards.
The data that needs to be indexed is sent to Elasticsearch using the HTTP REST API, asynchronously in the background. This is done by the async history executor component, which is built on the same foundations as the regular async executor (the history part here is because historical data is used for indexing).
Similar to the async executor, following properties are available:
flowable.async-history.thread-pool.core-pool-size=32
flowable.async-history.thread-pool.max-pool-size=32
flowable.async-history.thread-pool.queue-capacity=256
When using a higher number for these properties, do take into account that each one of these background threads needs a database connection. Make sure to enlarge the connection pool accordingly, like described above.
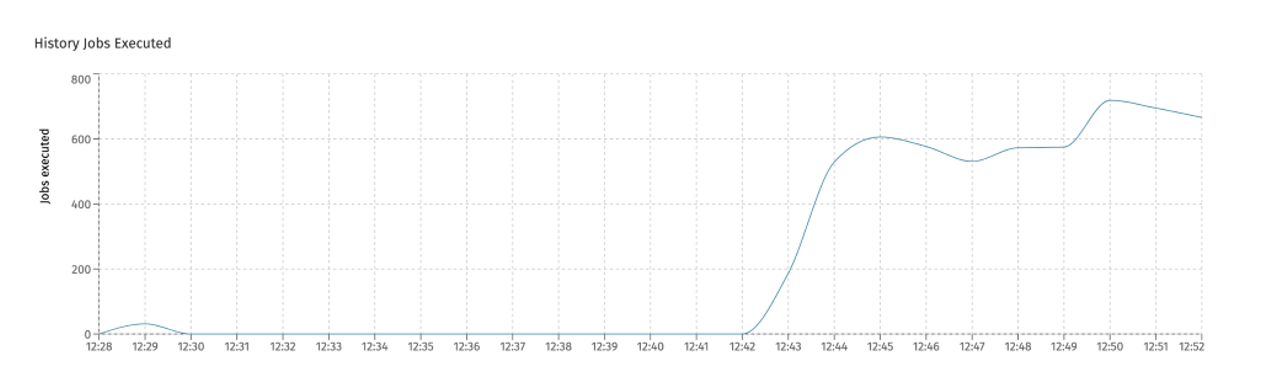
The amount of history jobs executed on each async history executor can be seen in Flowable Control (when metrics are enabled):
Secondly, properly setting up and tuning the Elasticsearch nodes is important here too. If those Elasticsearch instances are not ingesting the data quickly enough compared to the data produced in Flowable, more and more jobs will be created. This will eventually lead to rejected jobs. An indication of Elasticsearch not coping with the load, can be seen in Flowable Control in the average execution time chart:
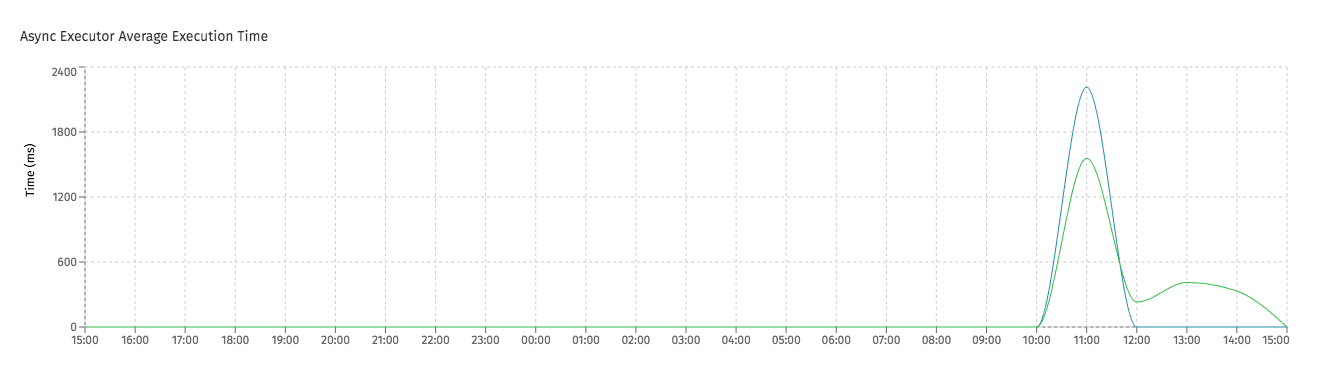
(In this screenshot, the average time for history jobs went up. Something to keep an eye on, as it could indicate Elasticsearch taking long to respond)
See the Elasticsearch documentation for details around tuning Elasticsearch (e.g. https://www.elastic.co/guide/en/elasticsearch/reference/current/tune-for-search-speed.html or https://www.elastic.co/guide/en/elasticsearch/reference/current/tune-for-indexing-speed.html).
Tomcat
(or similar web containers)
Flowable Work/Engage and custom Flowable applications typically run in a web container, such as Tomcat.
The browser or other systems will typically interact over the Flowable HTTP REST API. These requests are received by Tomcat and then passed on to the actual logic. Webcontainers such as Tomcat use threads (typically one thread per request) which are pooled in a thread pool.
When the number of concurrent requests rises (e.g. due to more concurrent users or integrations with other systems), the maximum number of threads can be reached. At that point, the request is stalled until a thread becomes available.
For Tomcat, this is configured in the conf/server.xml file. For example, when requests are received on port 8080, the max threads could be changed to 250 with following settings:
<Executor name="tomcatThreadPool" namePrefix="catalina-exec-" maxThreads="250" minSpareThreads="4"/>

<Connector executor="tomcatThreadPool" port="8080" protocol="HTTP/1.1" connectionTimeout="20000" redirectPort="8443" />
When running on Tomcat, the JVM settings described above should be applied to Tomcat.
Please refer to the Tomcat documentation for more details.
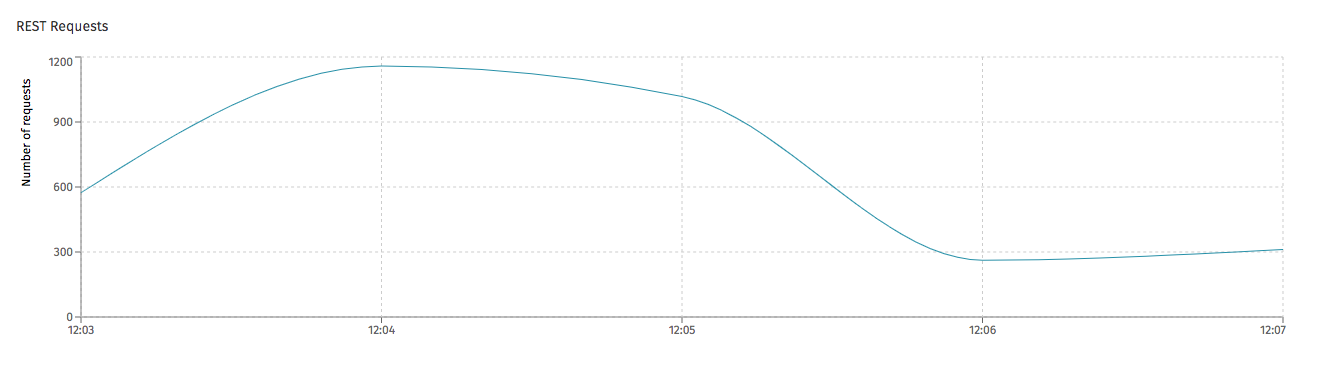
In Flowable Control (when metrics are enabled), it's possible to see the number of REST requests handled by the server:
Embedded Tomcat
If you're running Flowable as a jar instead of a war, an embedded Tomcat web container is used. To configure this Tomcat as described in the previous sections, following properties can be set:
server.tomcat.threads.max=250