Taking it a bit further
The real world isn’t so simple
Cases aren’t always that straight-forward
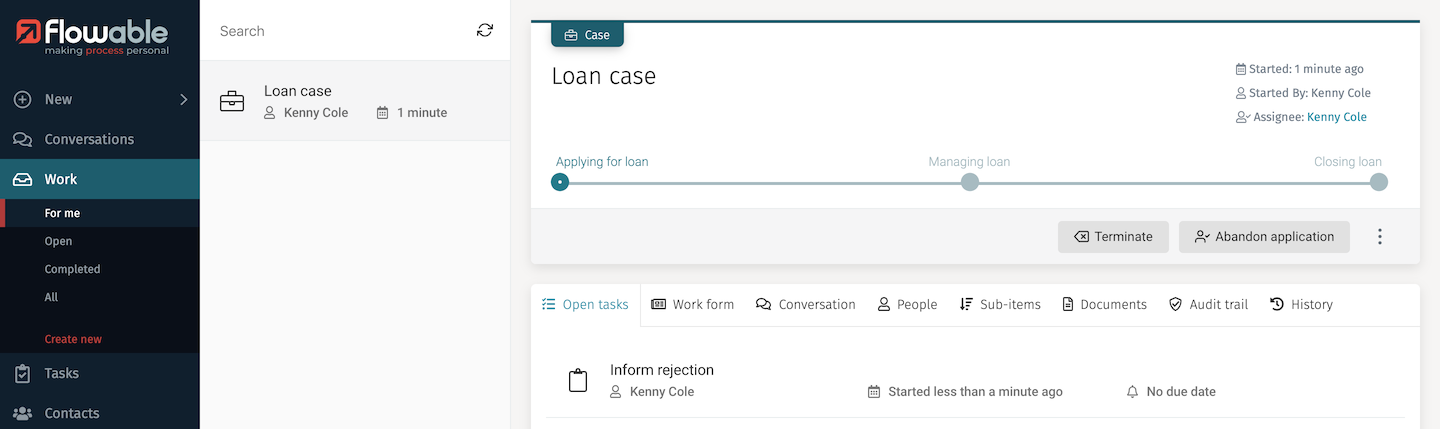
We’ll run through the same case as before but show how Flowable allows you to deal with the unexpected or unplanned. Create a new Loan case instance and follow the steps through to get to the Review application step. This time, click the Reject outcome button and you’ll see the Inform rejection task appear.
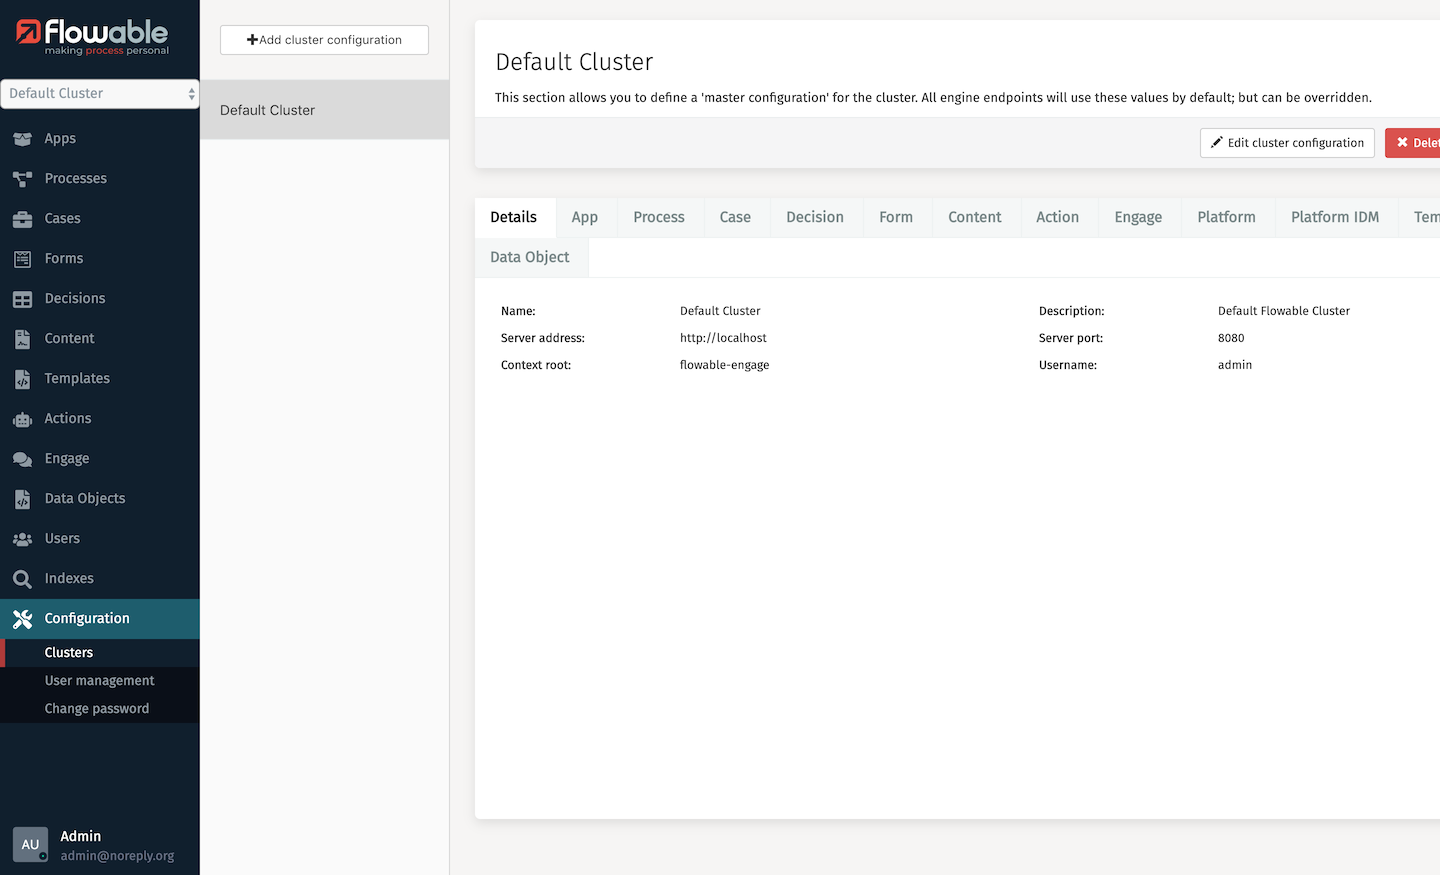
Now imagine that a co-worker points out that you keyed in a wrong value for the salary and that in some circumstances the loan application could have been accepted. How can that be done now we’ve passed the point in the process where the choice is made? Time to ask for help from the sysadmin to change the state of that specific process. You’re going to play that role now, so go back to the initial browser page at http://localhost:8080 and select Flowable Control (System admin console) or go to http://localhost:8080/flowable-control. This will prompt you to sign in: use the default admin user and password test, then you should see Flowable Control’s default cluster information.
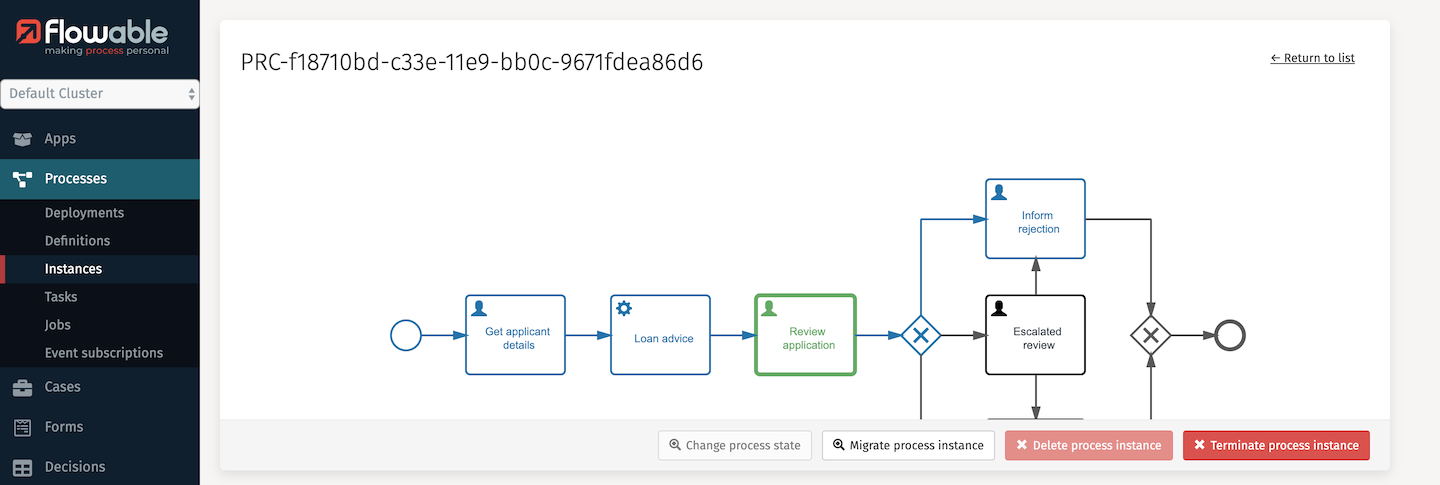
We want to inspect an active process instance, so select the Processes menu item on the left-hand side. Initially, you’ll see a list of process deployments including the loanApp.zip that you imported. Click the Instances filter under the Processes menu and you’ll now see a list of active process instances.
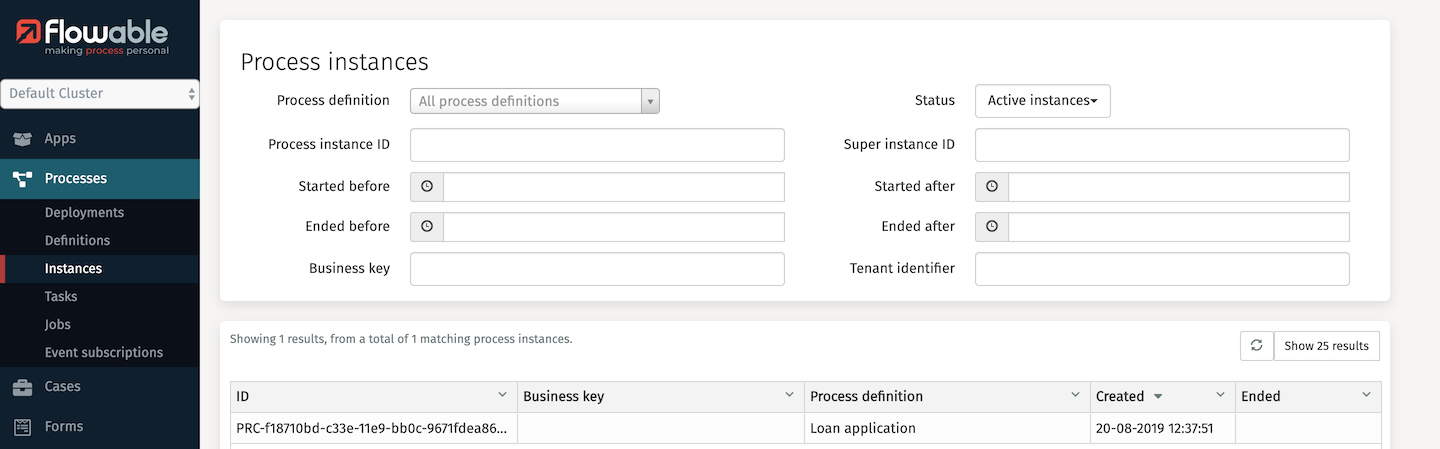
You should see just one listed, unless you’ve started multiple cases without finishing them. Select that one (or the latest created if you have several). You will now see a diagram of the process instance with the first few steps in blue to indicate these have been completed, and the Inform rejection step shown in green.
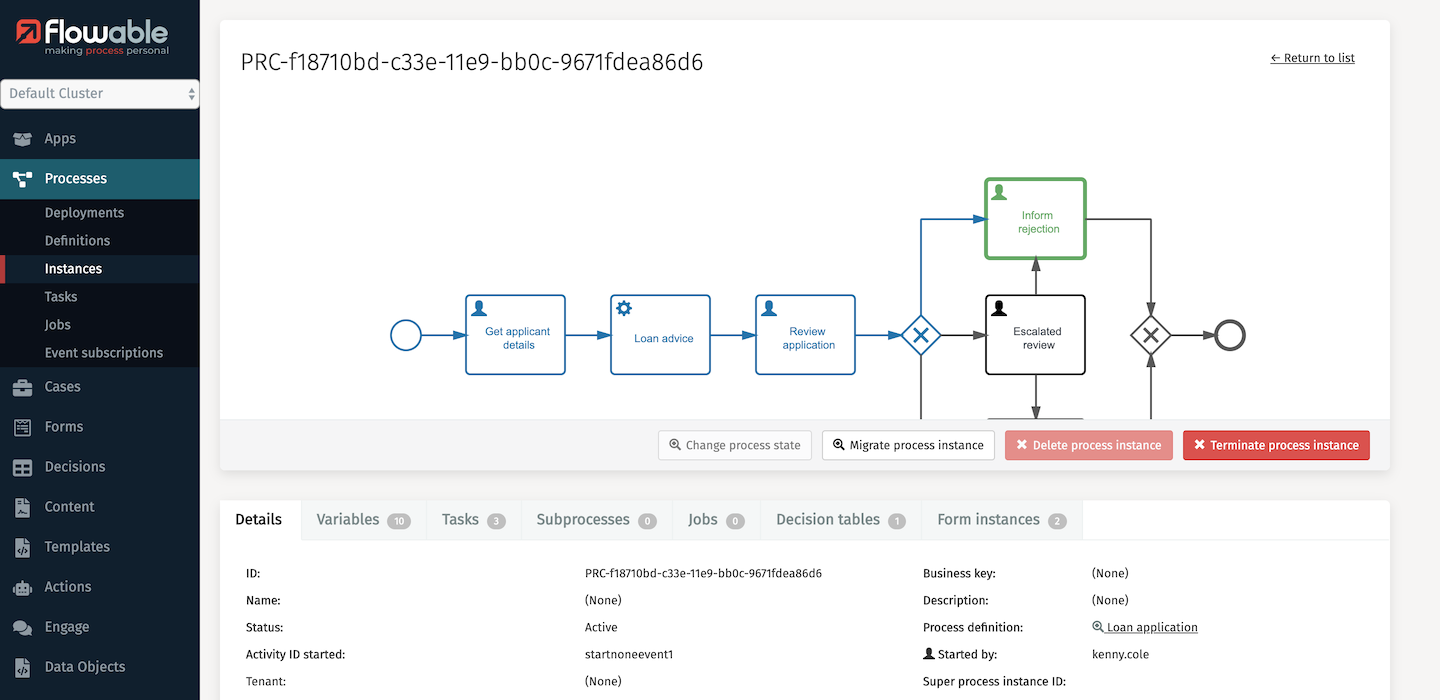
Below it there’s details about this instance, with tabs of different information. Click on the Variables tab and you’ll see all the variables and their values that have been collected so far. There are a number of things you can do from here.
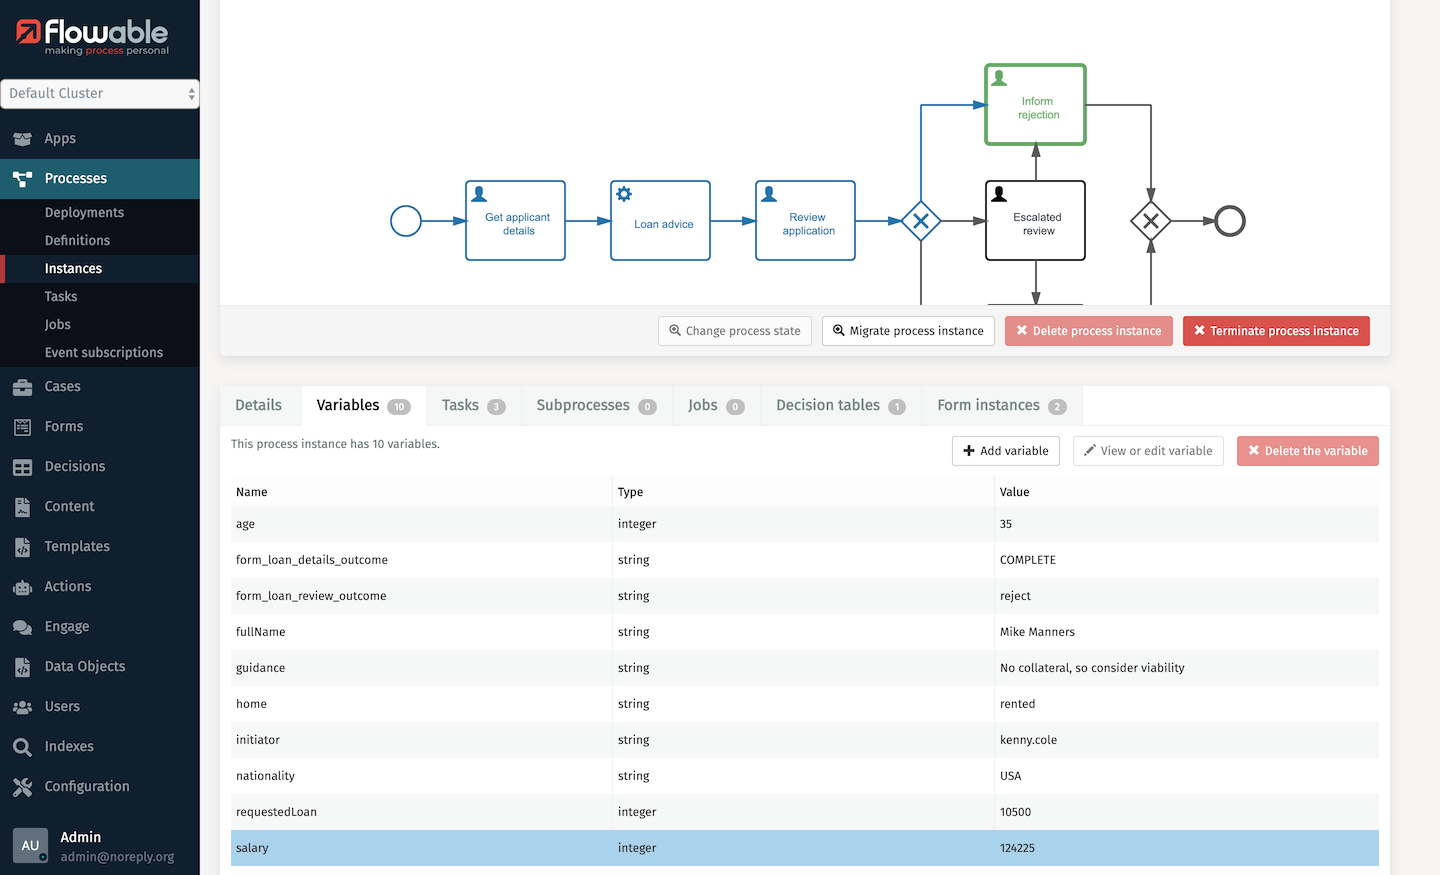
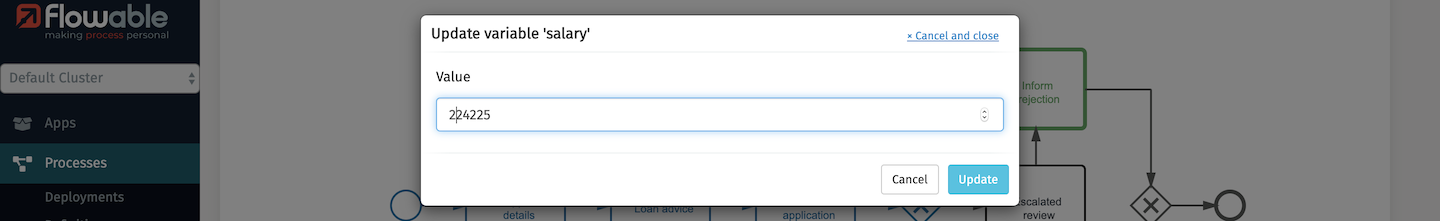
We need to change one of these variables because of the mistyped input. Select the salary variable and then click the View or edit variable button. A dialog will pop-up that will allow you to change the salary value to some other number. Make a change you’ll remember and click Update.
The other thing we need to do is change the state of the process back to where we can make the decision to accept it. Go to the process diagram and select the Inform rejection step, which will highlight it in a blue glow. We want to change the state back to the Review application step, so now select that step, which will highlight it with a red glow.
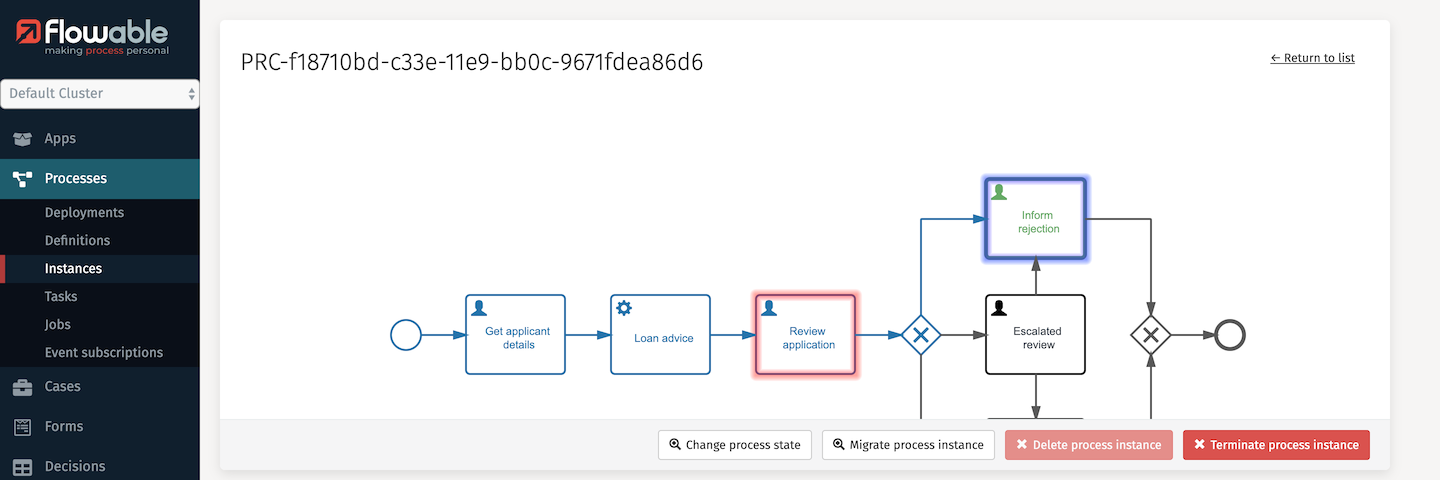
The Change process state button under the diagram will have become enabled, so click it. You will be prompted to confirm you want to change the state - click CONFIRM. The diagram will have changed so that the Review application step is now green and the Inform rejection step is blue. Even though we have reset the state, Flowable records what steps have happened as part of its history.
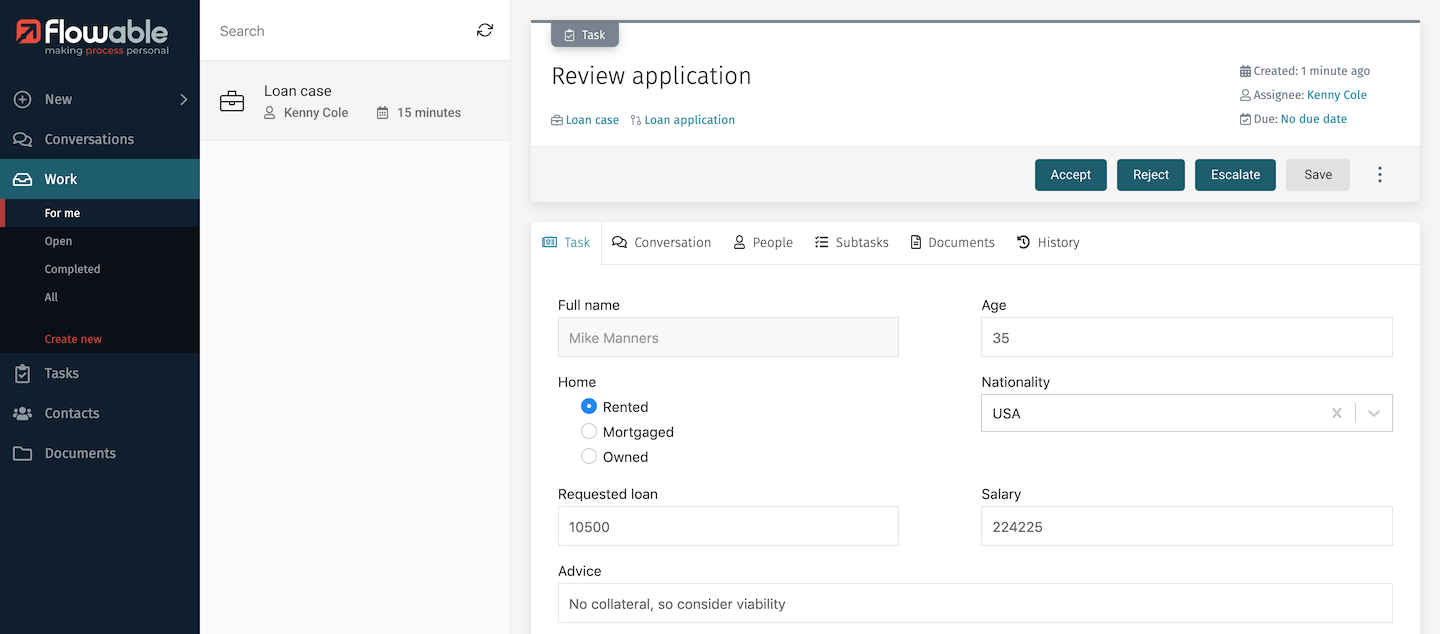
That’s it with Flowable Control for now. There’s lots of other capabilities it has that we won’t cover in this tutorial. Switch back to Flowable Work – if you still had it running in a separate window or tab, refresh it. You’ll see the case view is showing Review application as the current open task with the changed salary.
We’re going to see one of the very special capabilities of Flowable next, dynamic process injection, and we’ll continue with this corrected process instance to deal with an exceptional set of steps we need to carry out.
Reporting and analytics
Once you have run the case and processes a few times, you’ll have some historic data that you can analyze visually. There’s a couple of ways you can do this, through the Reports FlowApp and with custom Pages.
Custom Page models
There are a couple of custom dashboard pages already in the LoanApp, they’re just not exposed yet. What you need to do is go back to Flowable Design and edit the LoanApp to enable them. Sign in to Flowable Design using admin and test and you should be taken to the Apps list.
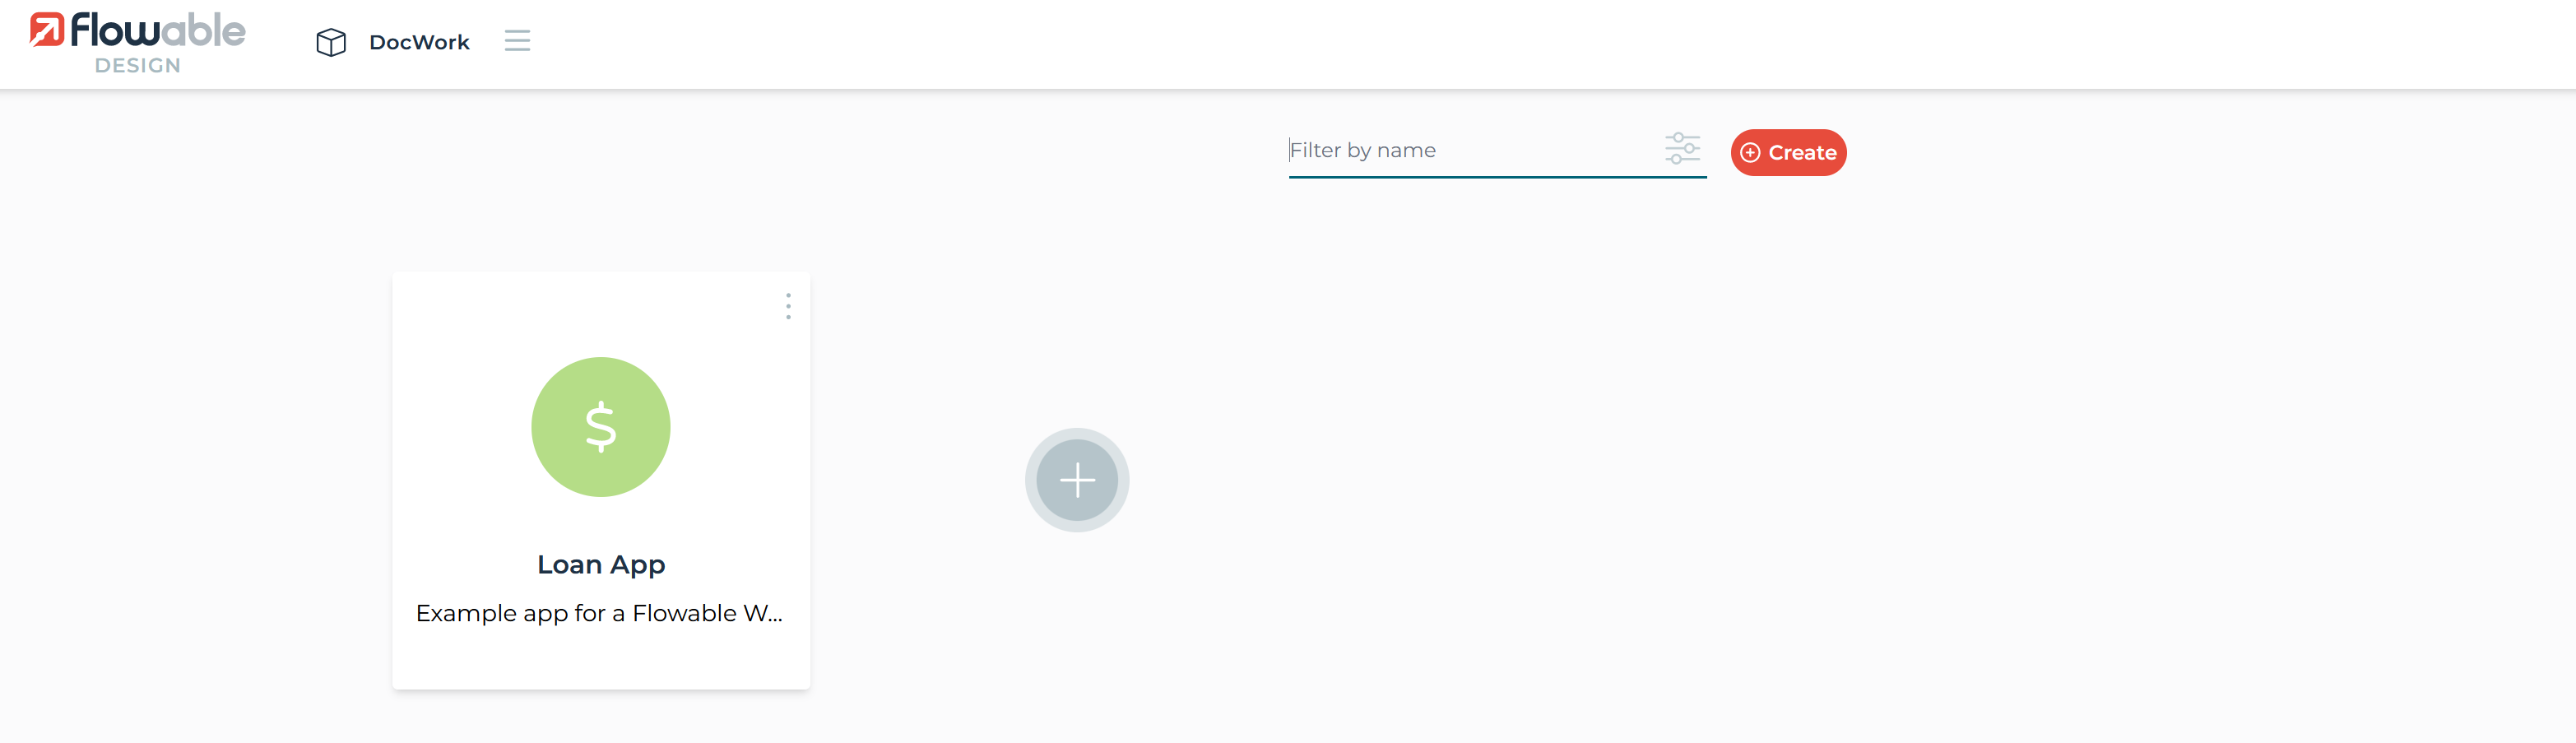
Select the Loan App and you’ll see all the different models that make up the overall app.
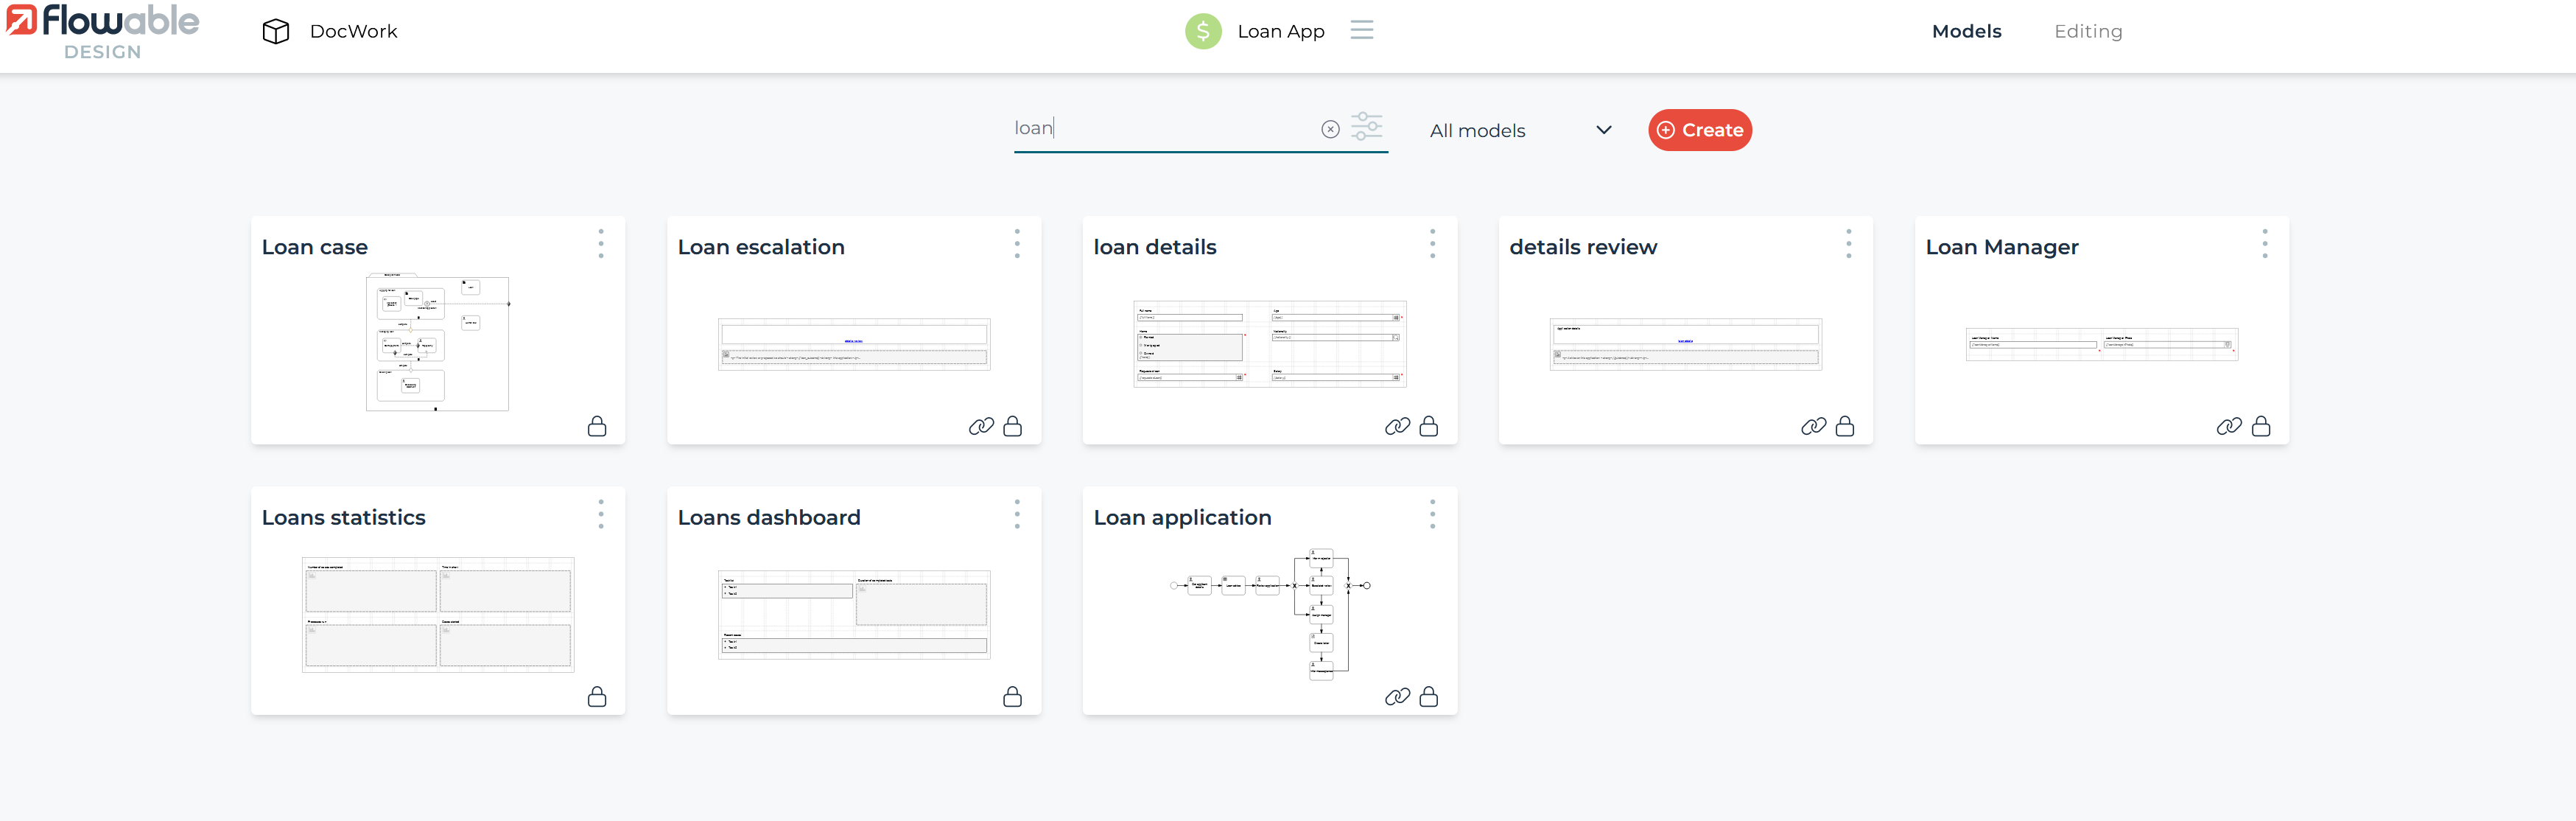
To enable the custom dashboards, you need to click the Configure pages button which is on the menu on the right hand side. Pull it open and click the 4th Icon down. Then select Enable pages In the dialog box that appears, you’ll notice a checkbox Include FlowApp pages that is unselected.
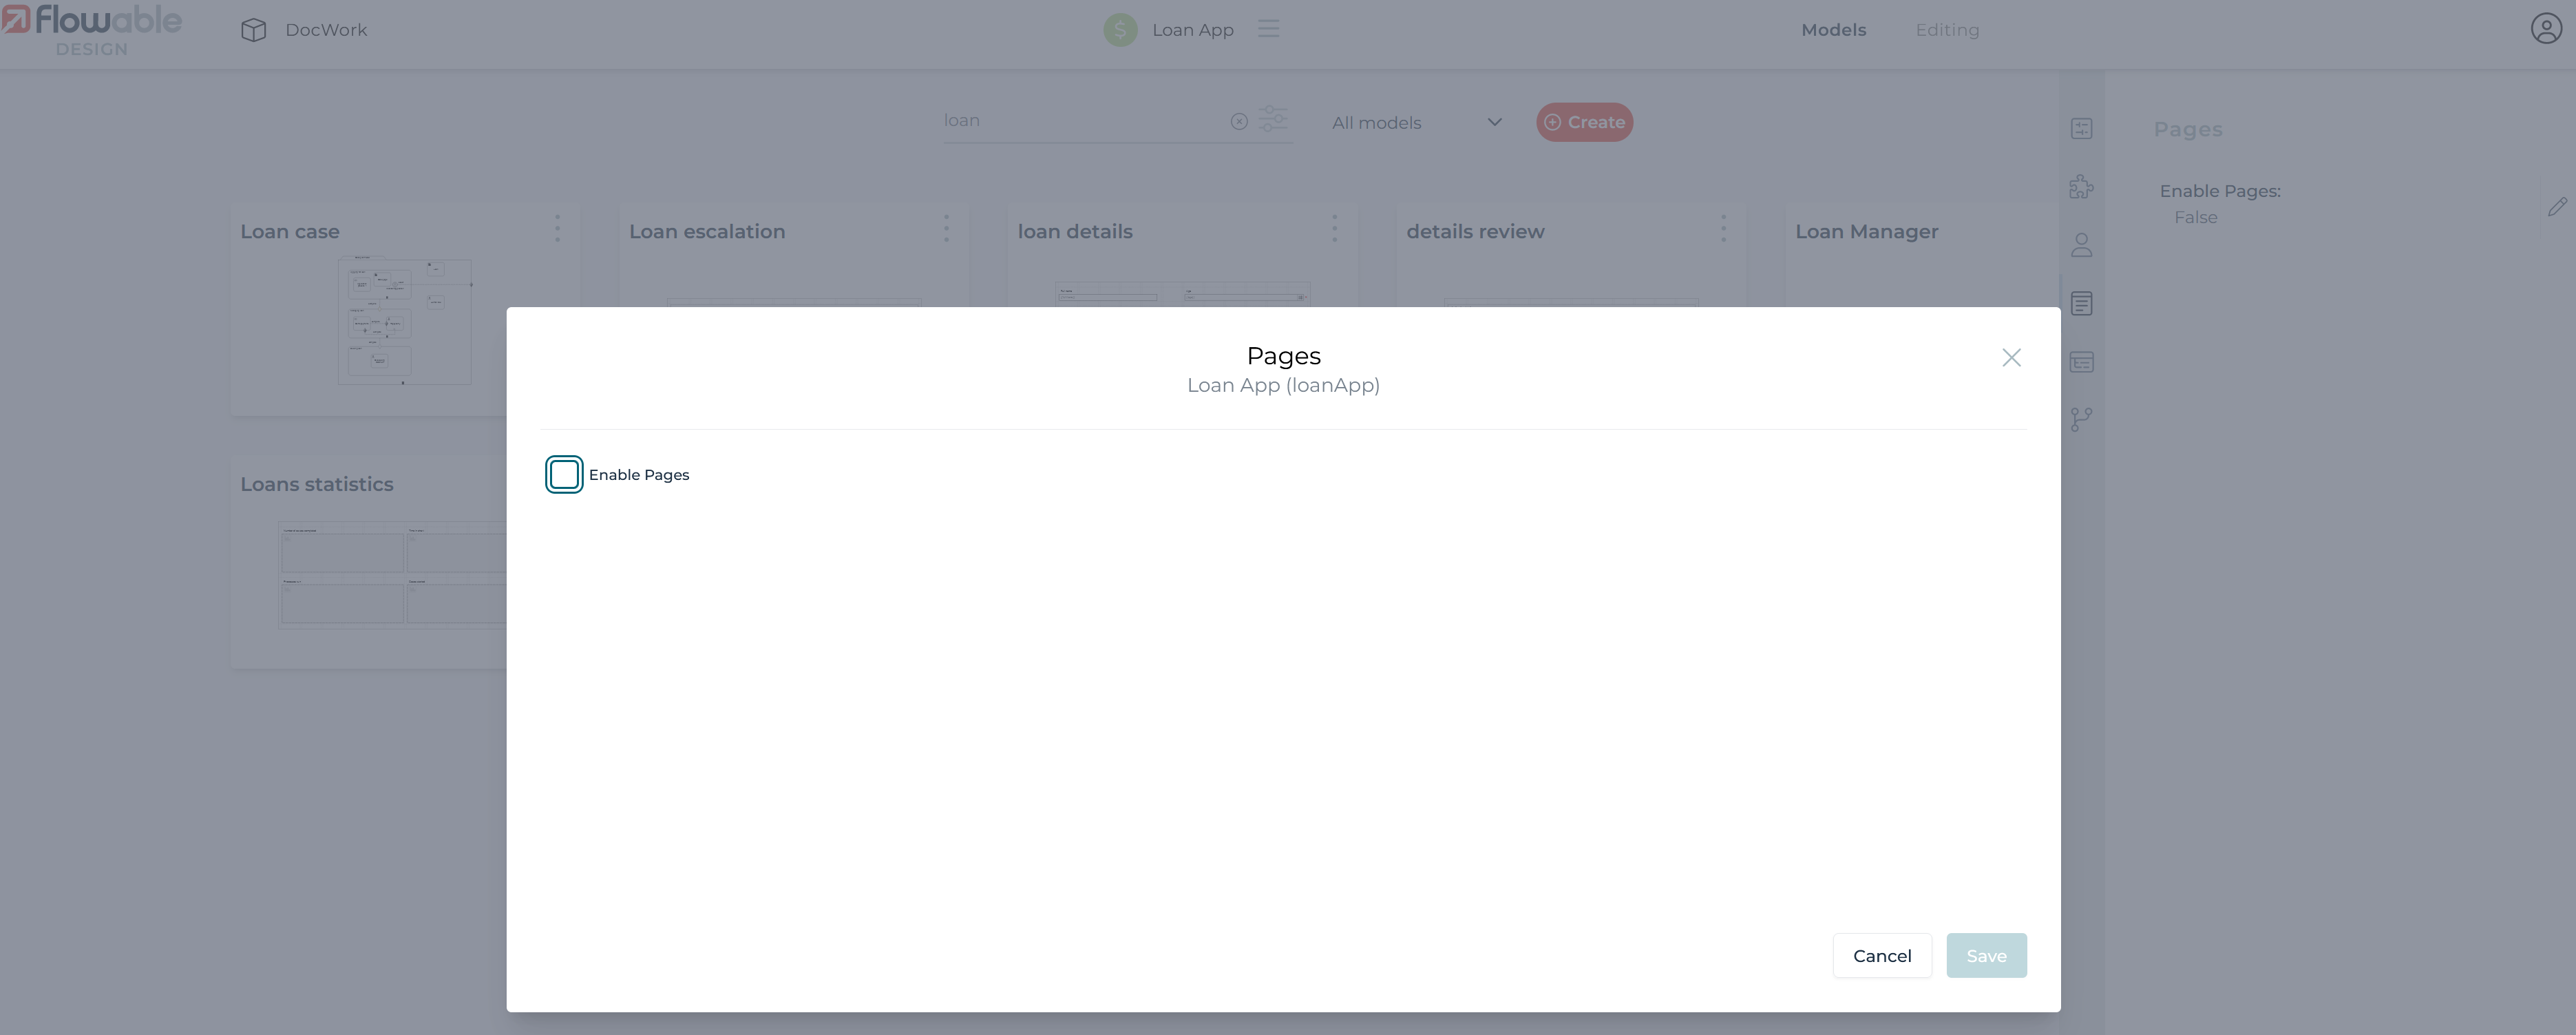
Select the Include FlowApp pages checkbox and the dialog will expand to show two Pages that were part of the imported app, just disabled. You will need to click the "Select Pages to Add" box.
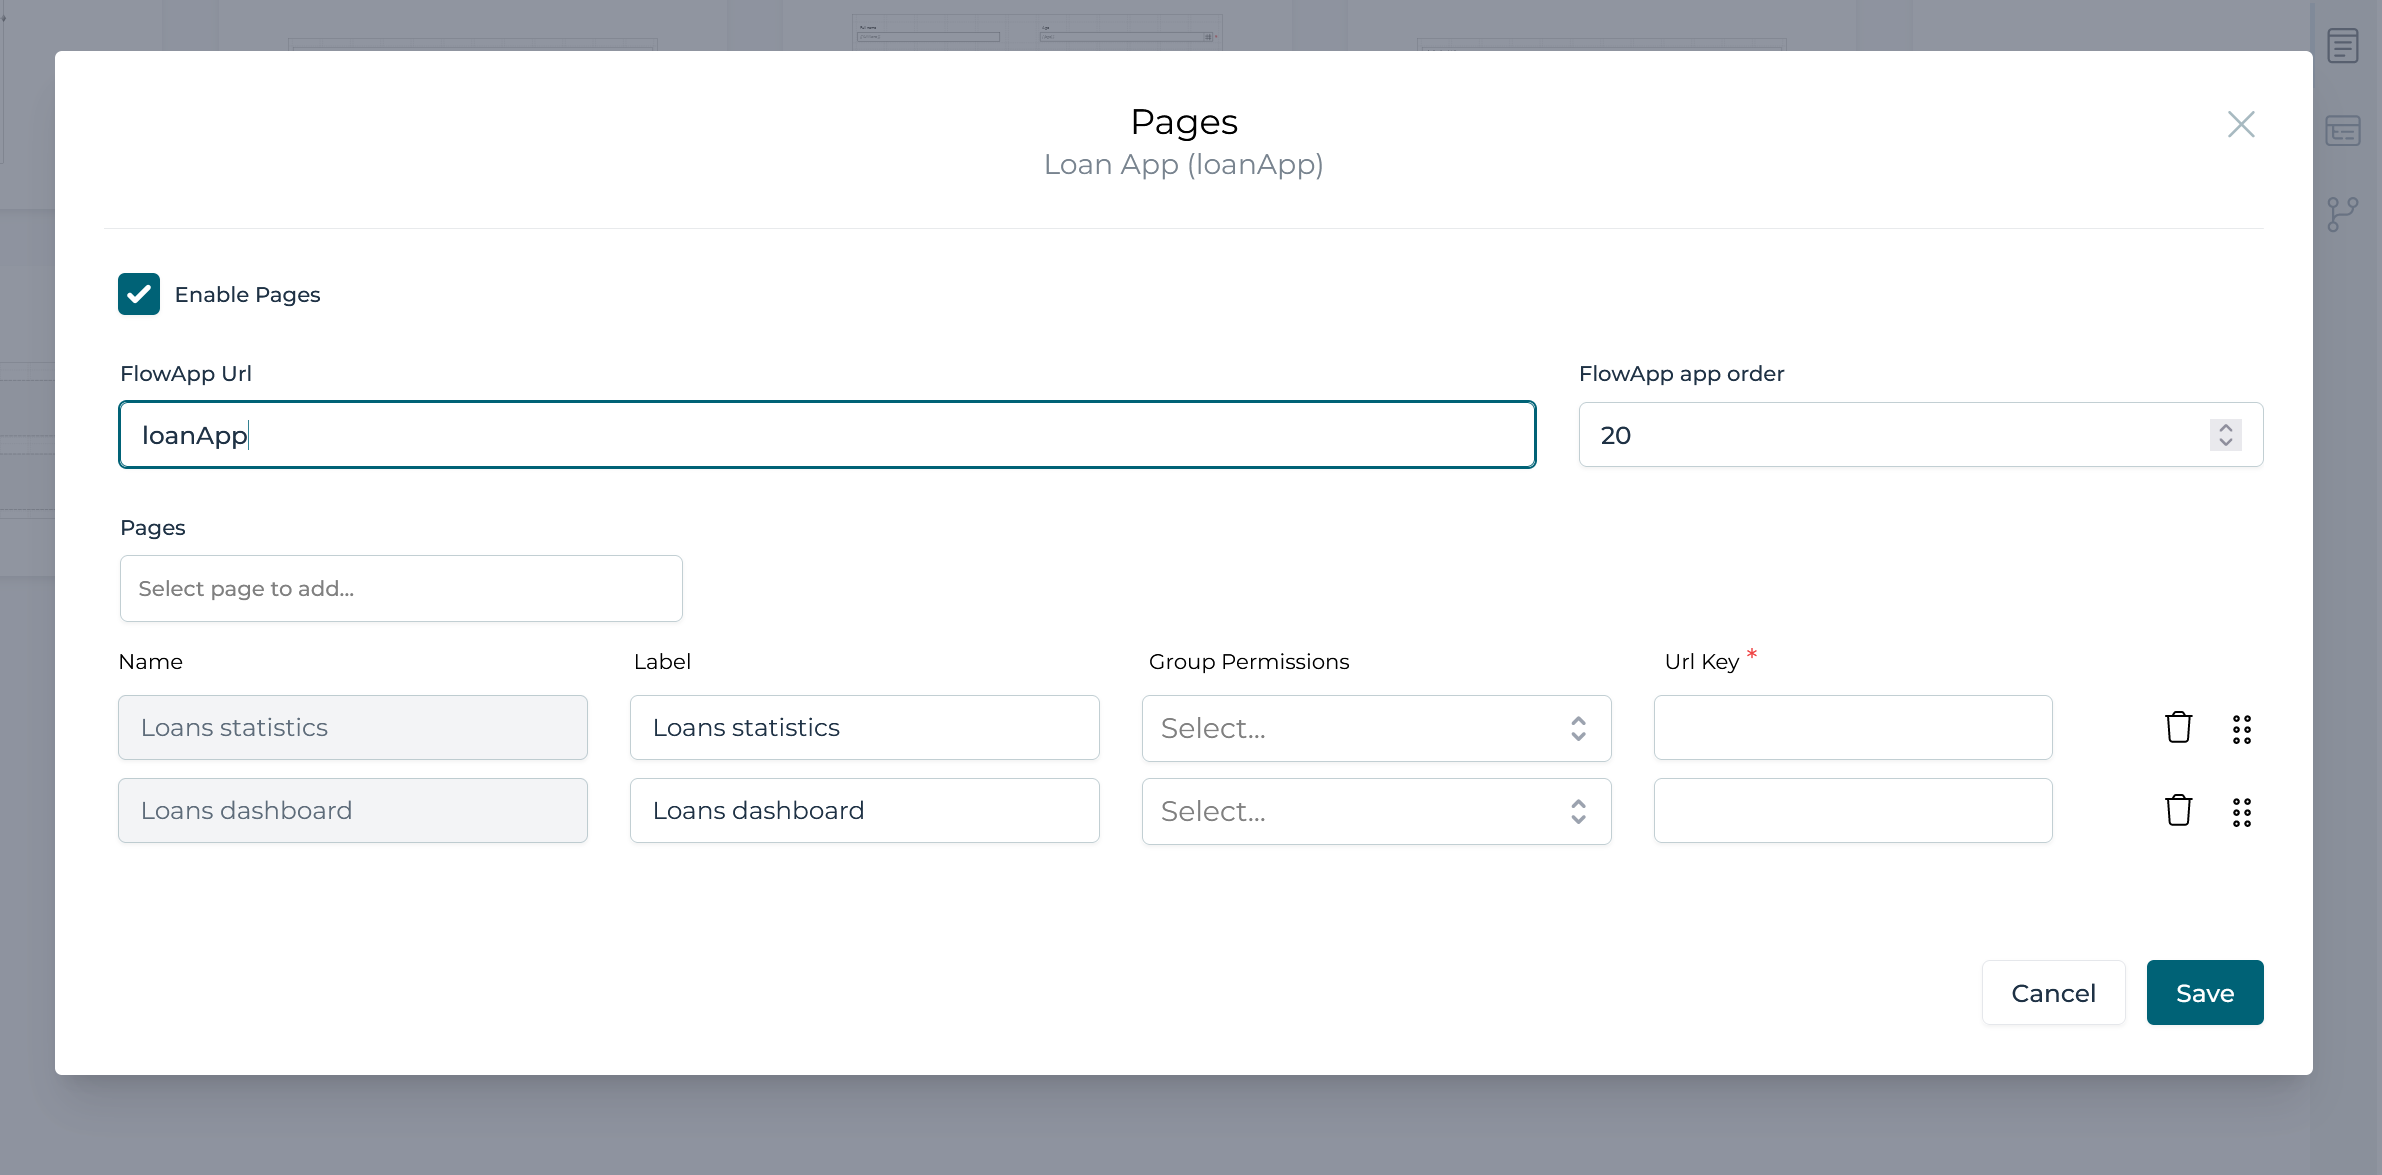
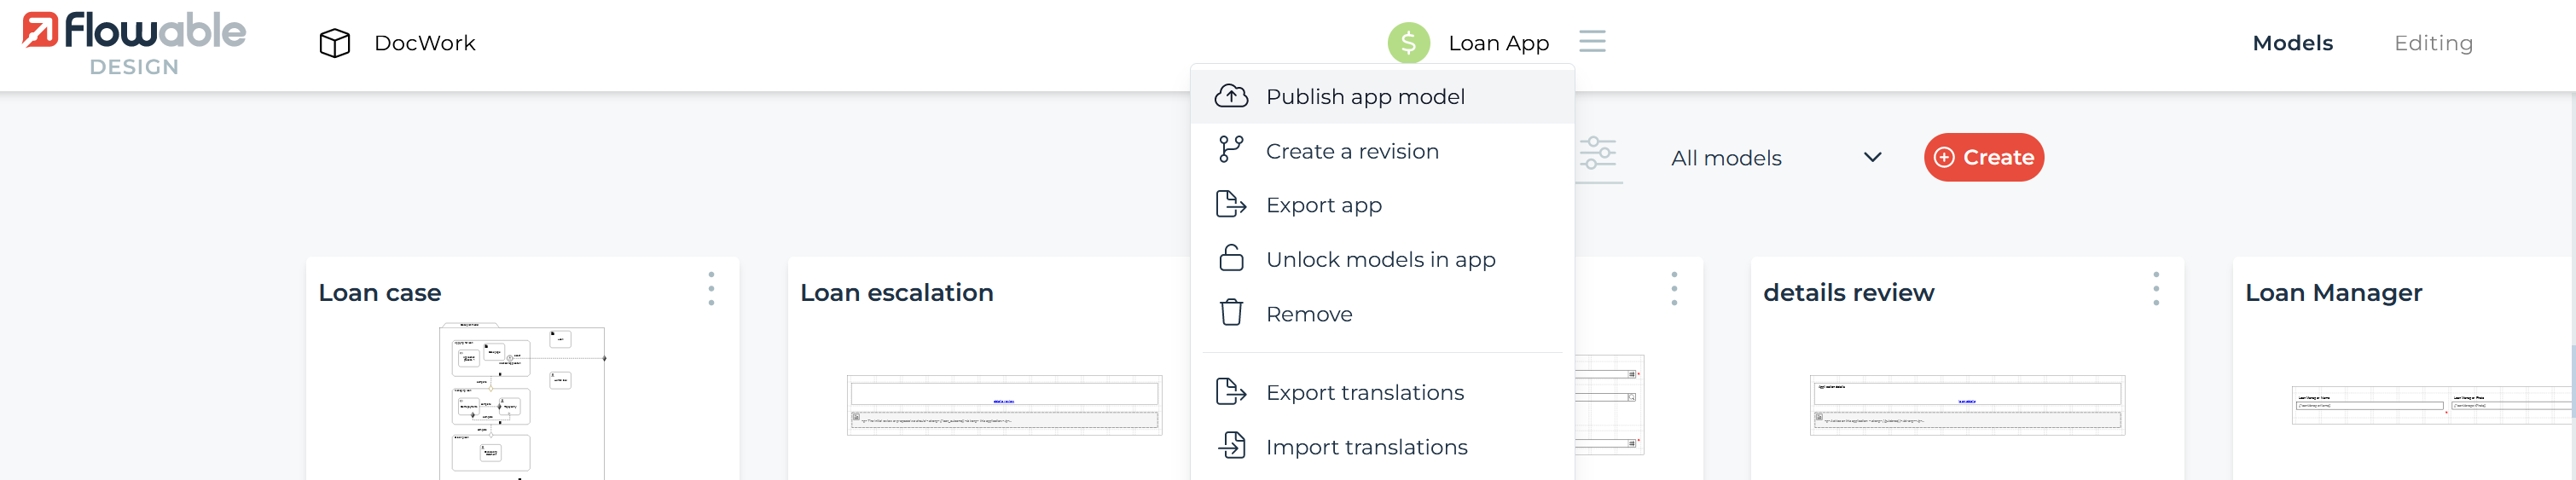
You can have as many Pages as you like and order them to your preference. Click the save or cancel button at the bottom and you'll return to the app view. Click the Publish and the pages will now be active (along with any other changes you might have made to the app).
Built-in reports
To view the charts on these pages and also see the Reports FlowApp, you need to have the appropriate Reports permission. Kenny has this permission, although not all users will. If you’re still signed in to Flowable Work as Kenny, refresh your browser, otherwise sign in as Kenny again. You can now see the Loan App’s pages that you’ve just published. If there’s more than one page for a FlowApp, a sub-menu for each page is shown.
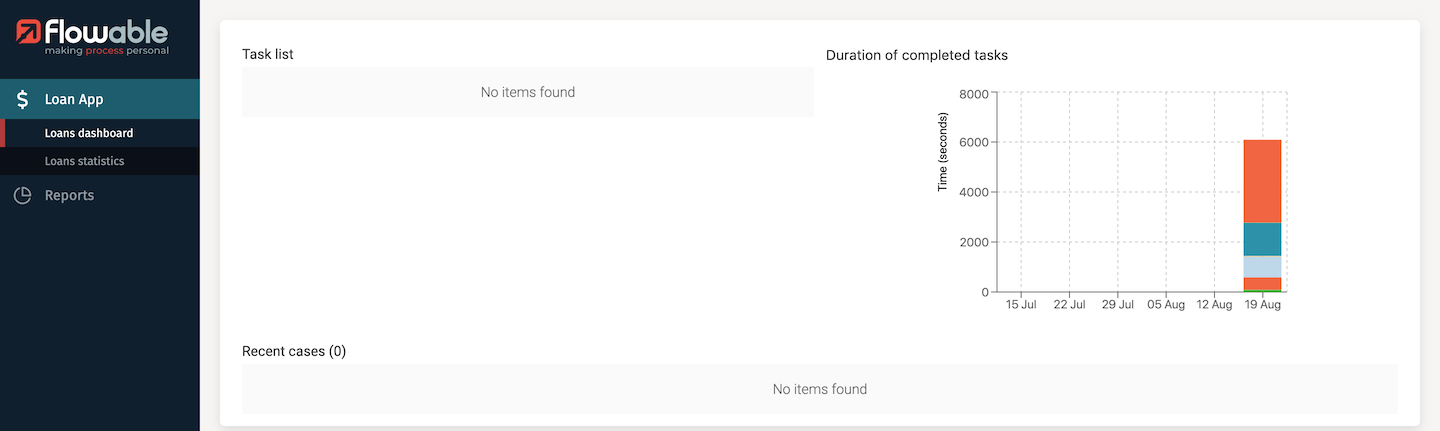
When you add Pages to an app, you can also give a position ranking, so you can get the FlowApps in the order you wish. Click on the Loans statistics page to see a few more charts. These pages were created in Flowable Design by dragging and dropping the page components into the desired layout - much the same as creating a form in Flowable Design, which we’ll show in a later chapter.
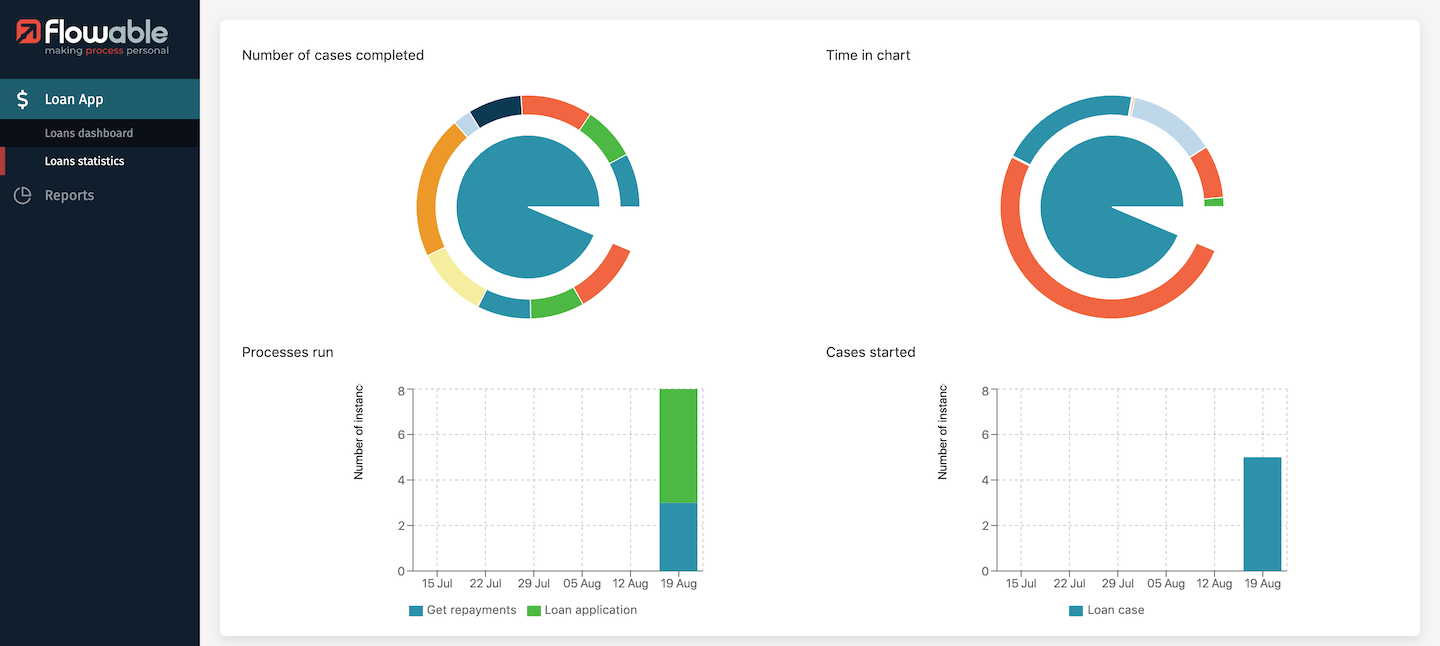
There are a range of different reports with parameters that you can set to cover which cases or processes to report on, over a date range and aggregated in different ways. The following is something like what you should see if you’ve just started running Flowable - only one day of task activity.
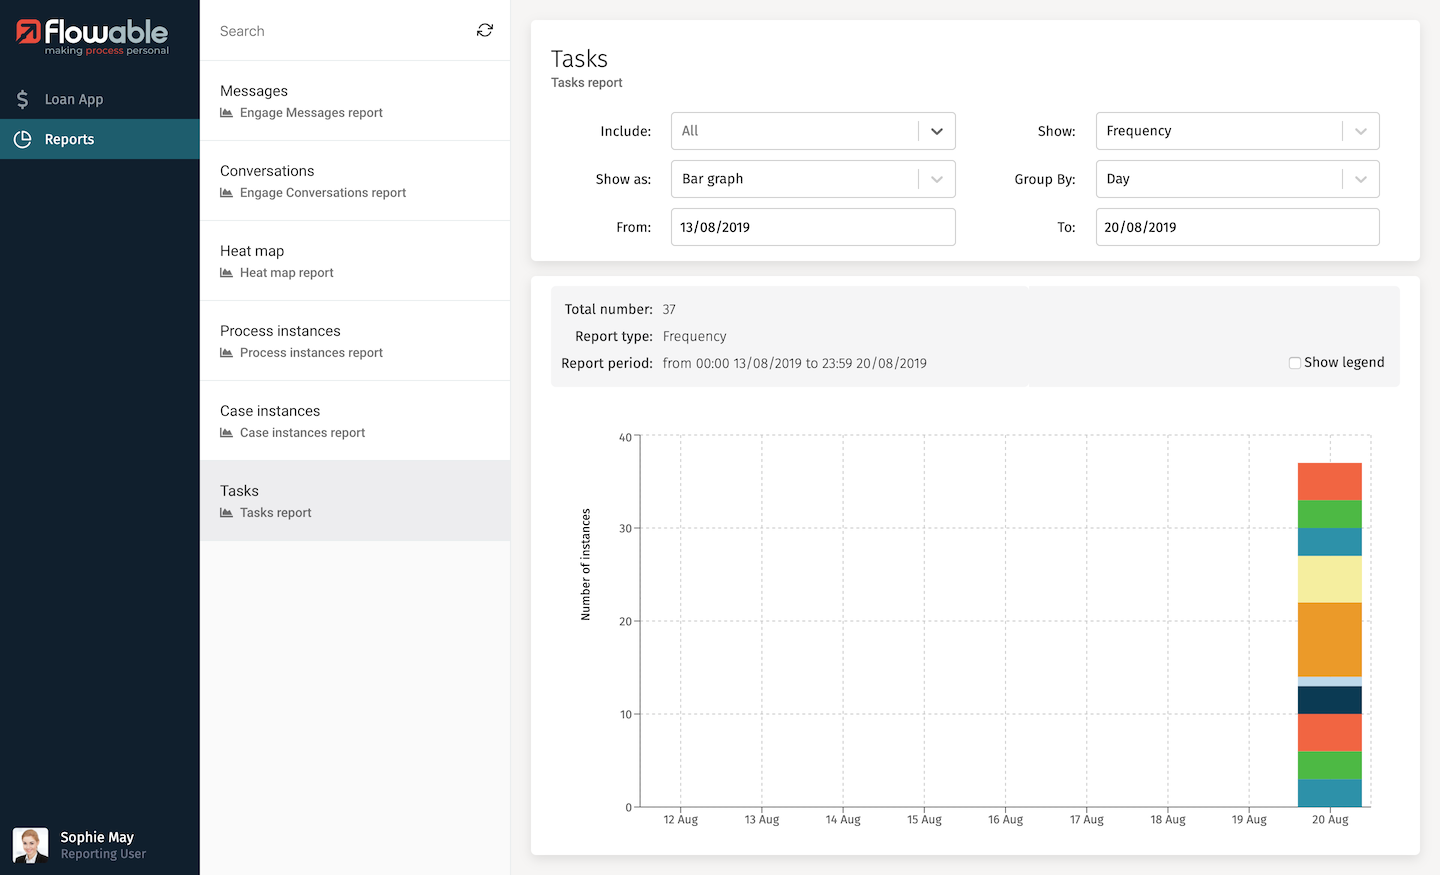
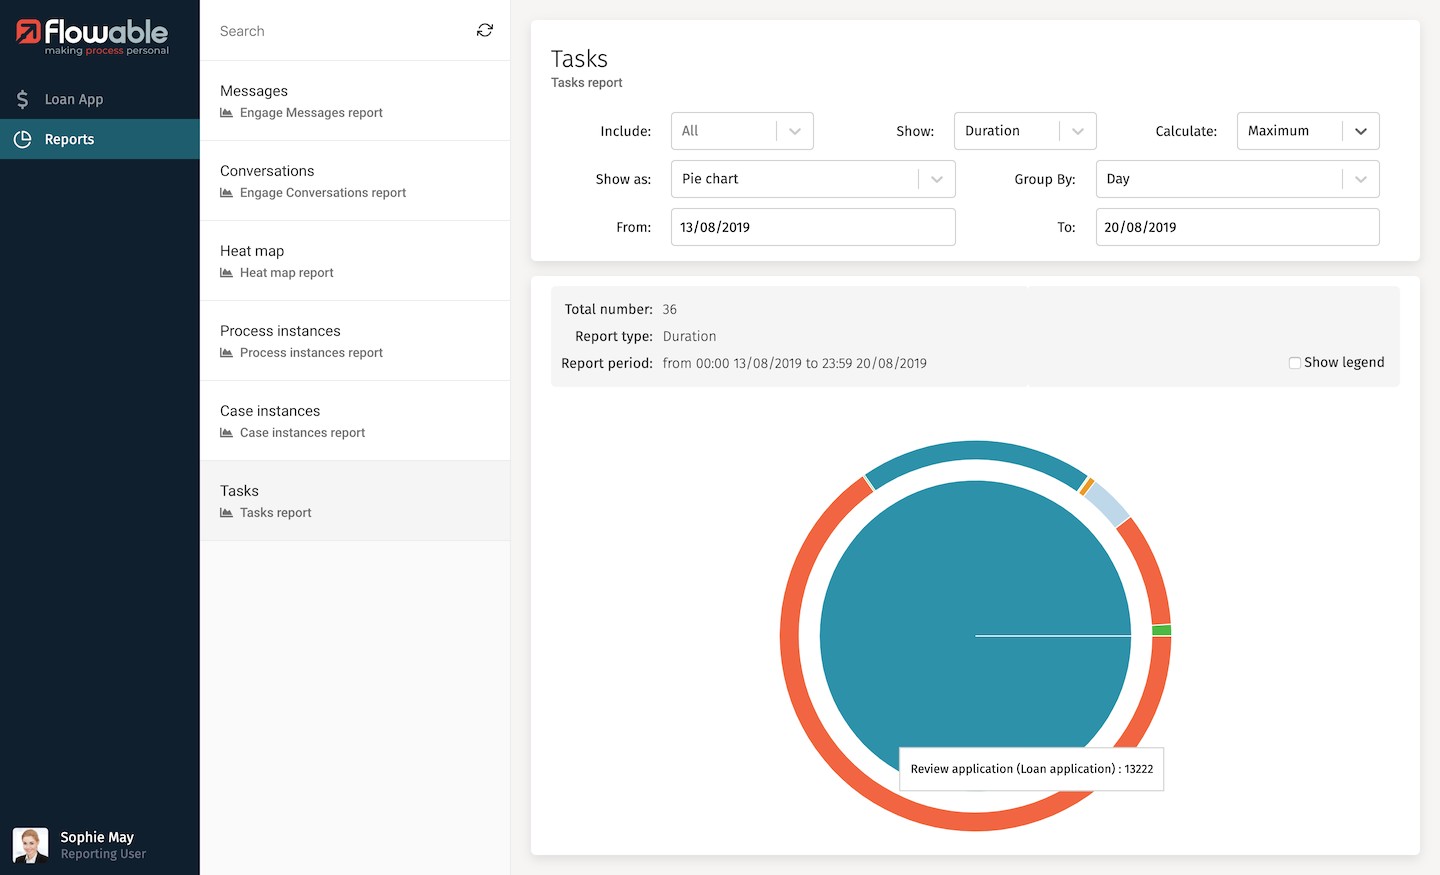
The charts will usually show additional detail if you hover over different parts of them. You can also turn the legend on or off, depending on how many items are being reported. Try a few variations of the task report, such as a pie-chart based on the maximum duration of tasks.
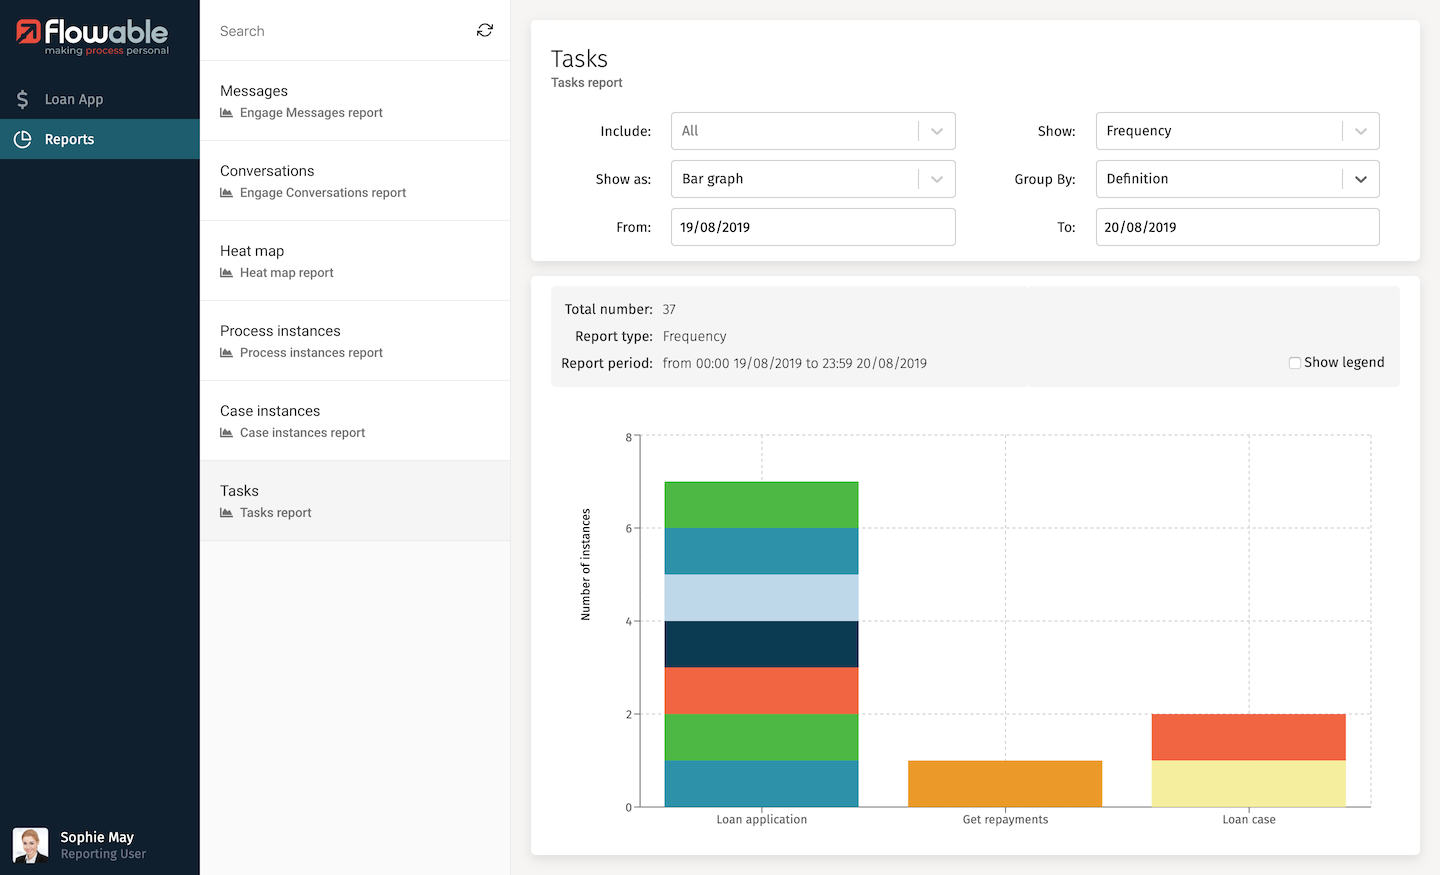
One of the grouping options is Definition, which allows you to see the task information stacked by case or process.
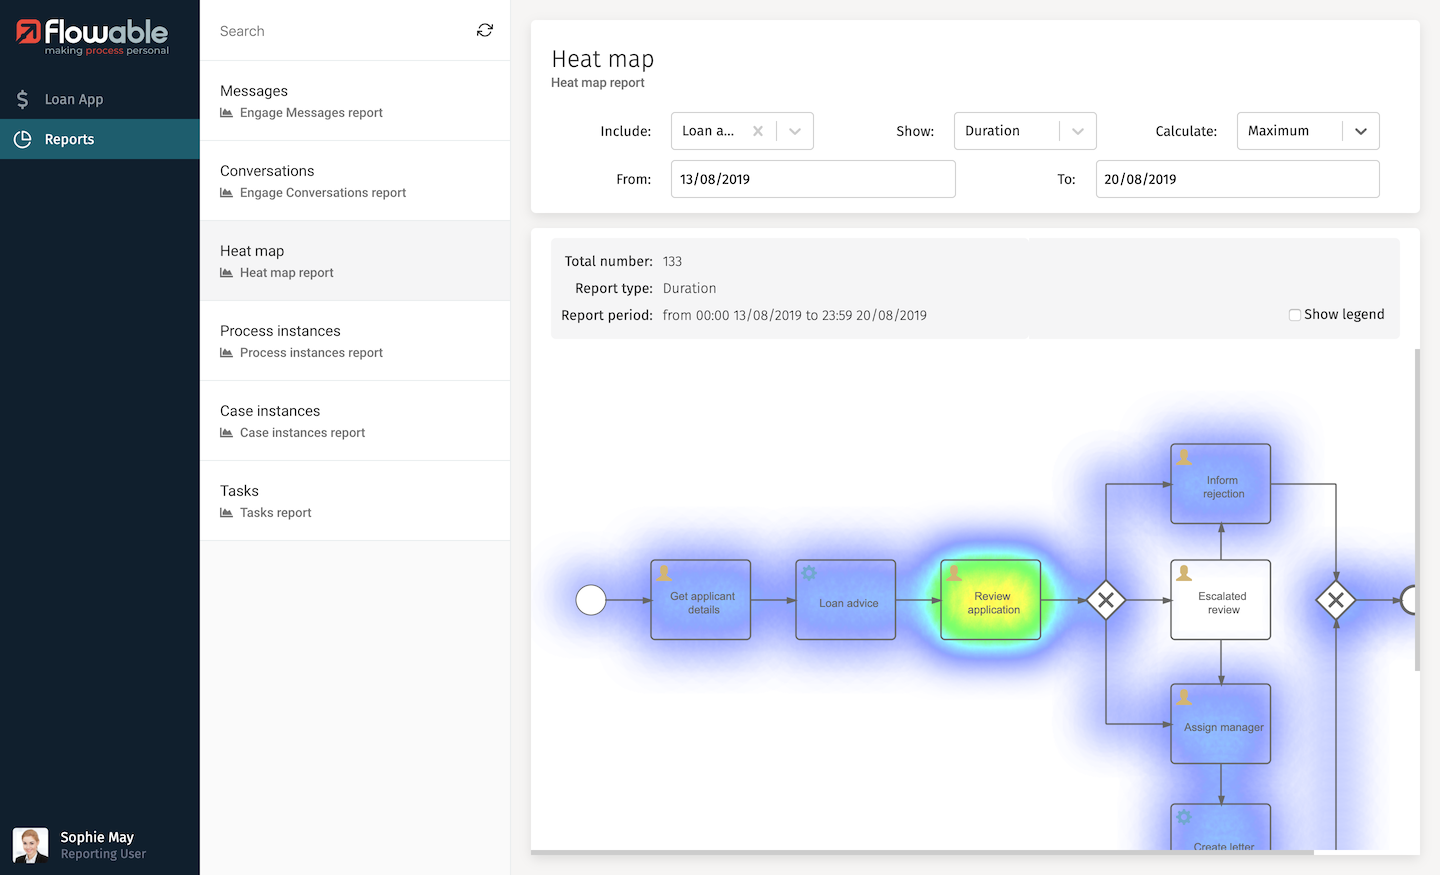
A popular report is the heatmap for a process. You need to select a single process to see its heatmap, where it shows the frequency or duration of a step by a heat color. In the example below, you can see that the maximum time over all the uses of this process has been spent in the Review application task, and that the Escalated review path hasn’t been used at all.