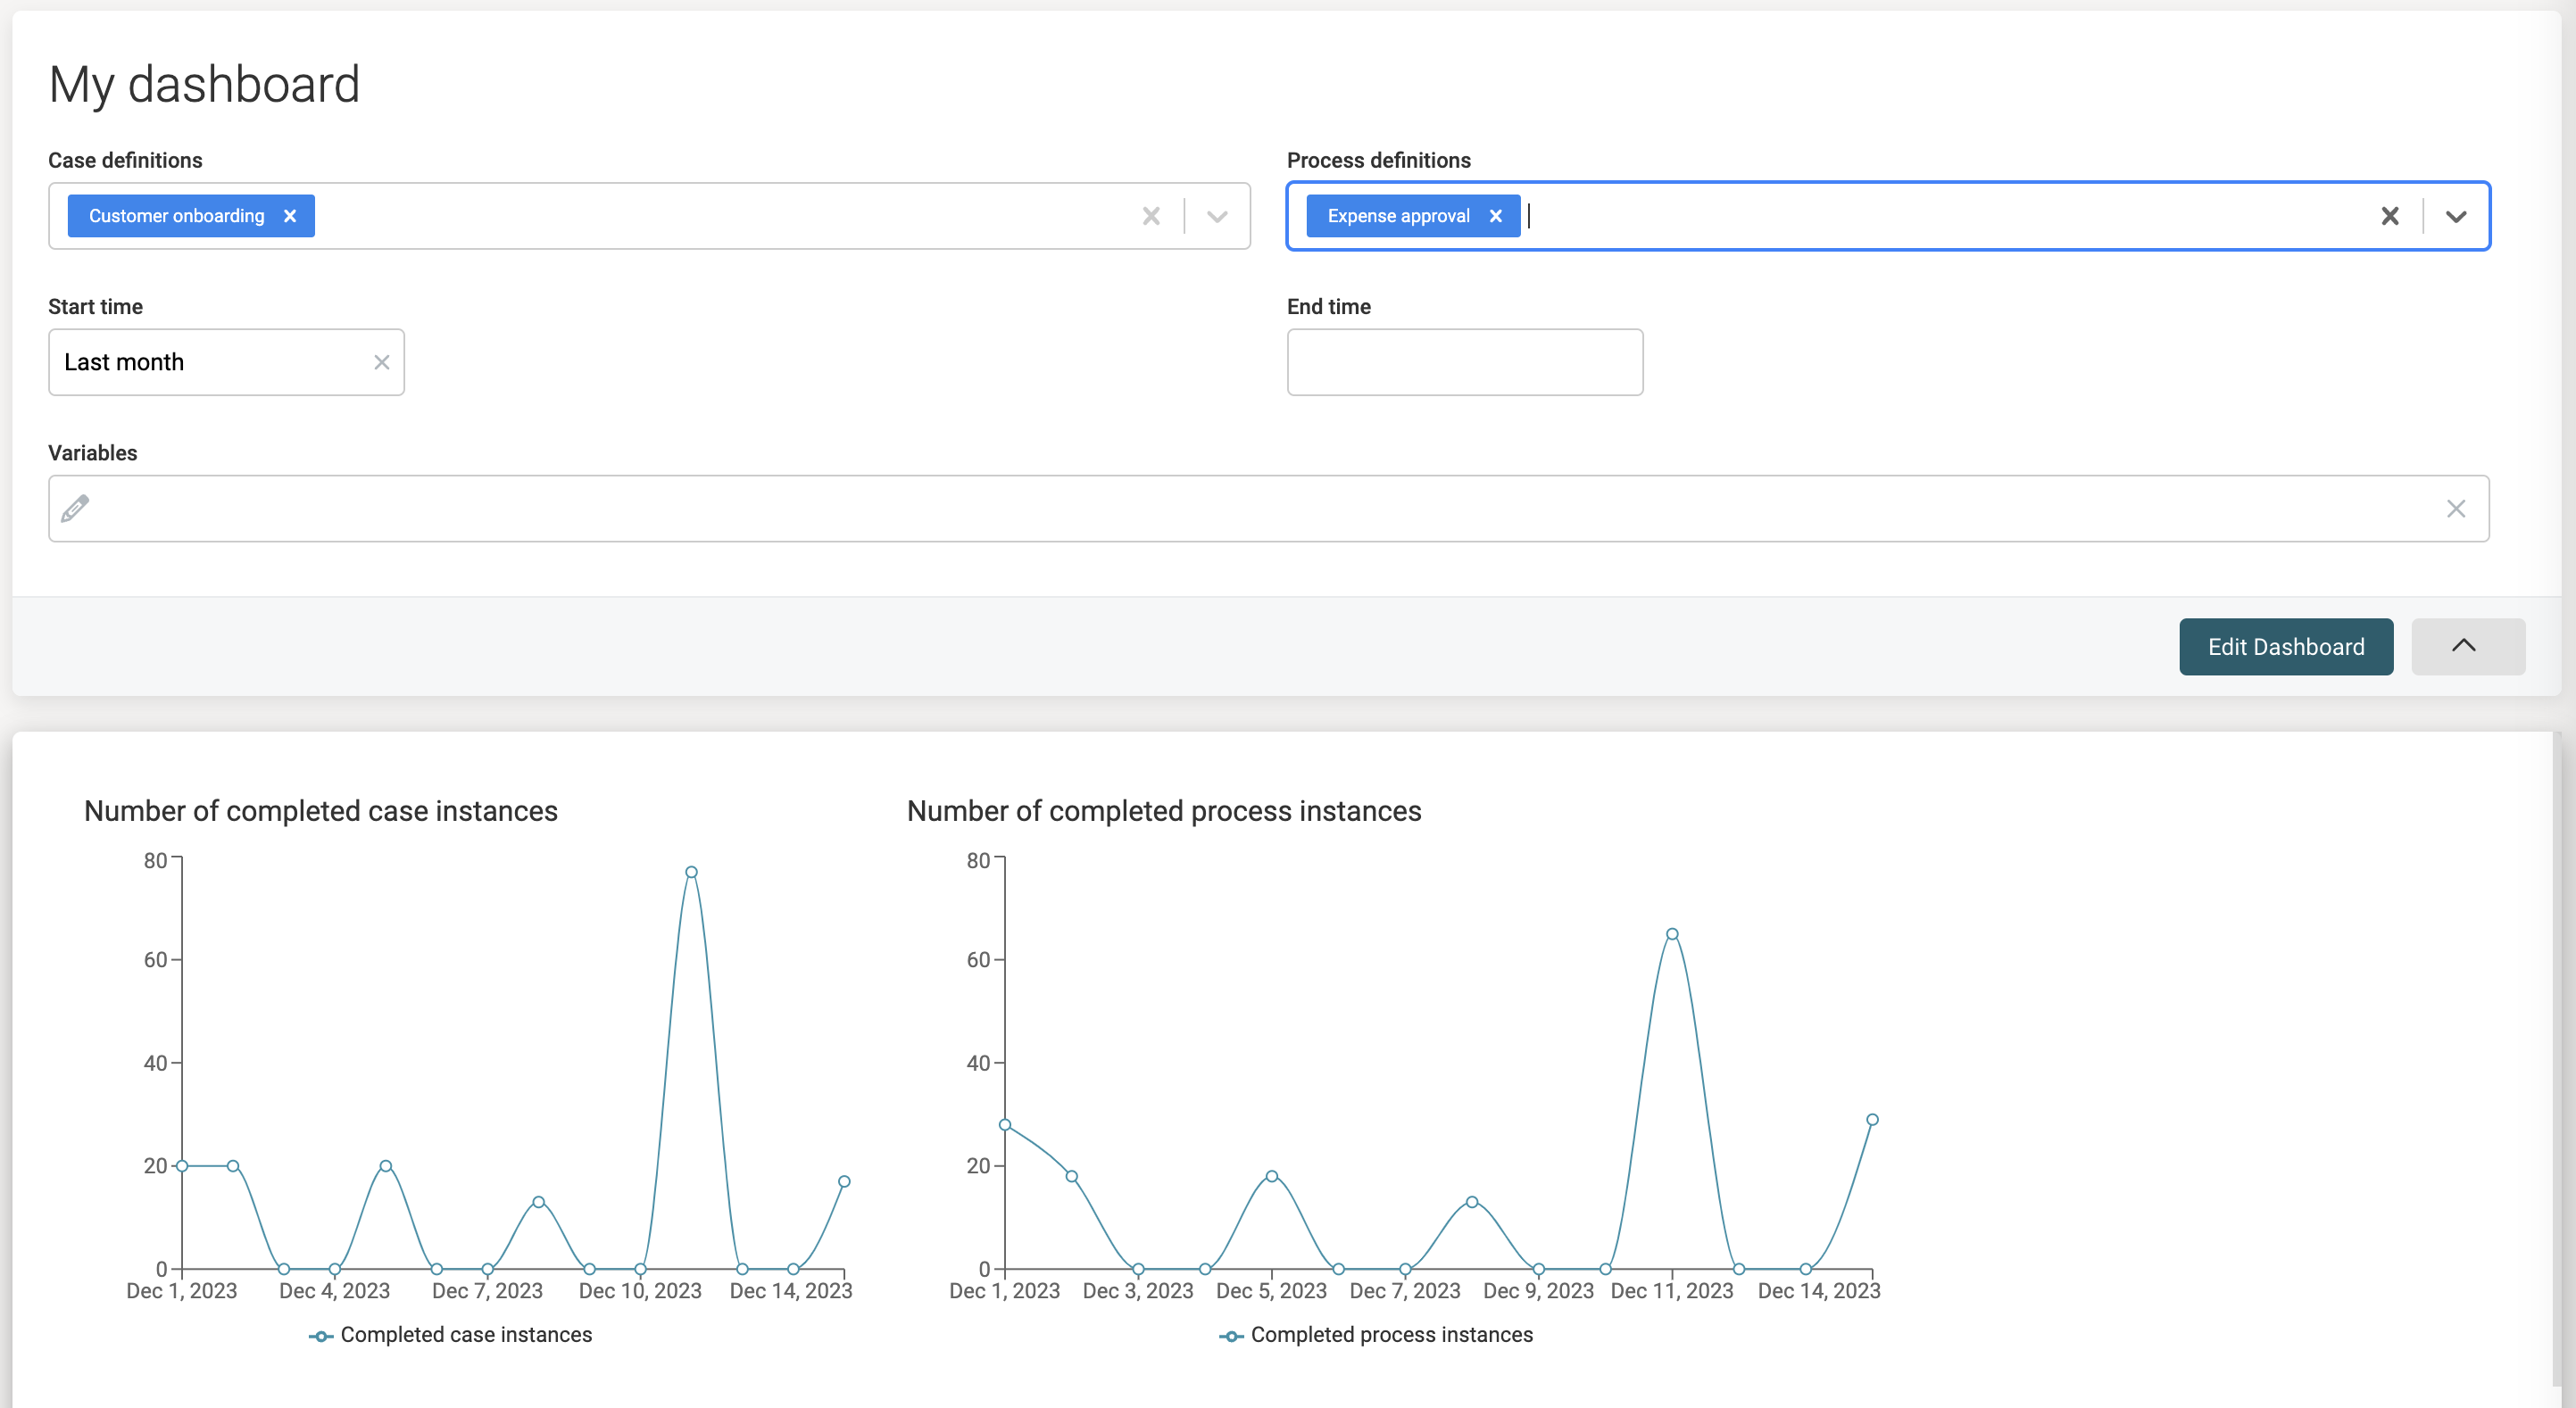
Line Chart Dashboard Component
Introduction
A Line Chart dashboard component displays key-value data pairs, where the key is put on the x-axis and the values on the y-axis:

Configuration

A line chart component can have two specific configuration settings:
- The Title is a default title that is suggested to the user when selecting this component from the component catalog. The user can still decide to give it a different name in the dashboard.
- The legende allows to specify a label for the legend that is shown in the chart.
Aggregation Definitions
The line chart component can display a list of key-values, where the key is a timestamp. As such, only aggregations such as for example the 'Group by started data' can be used:
