Dashboard Component Model Concepts
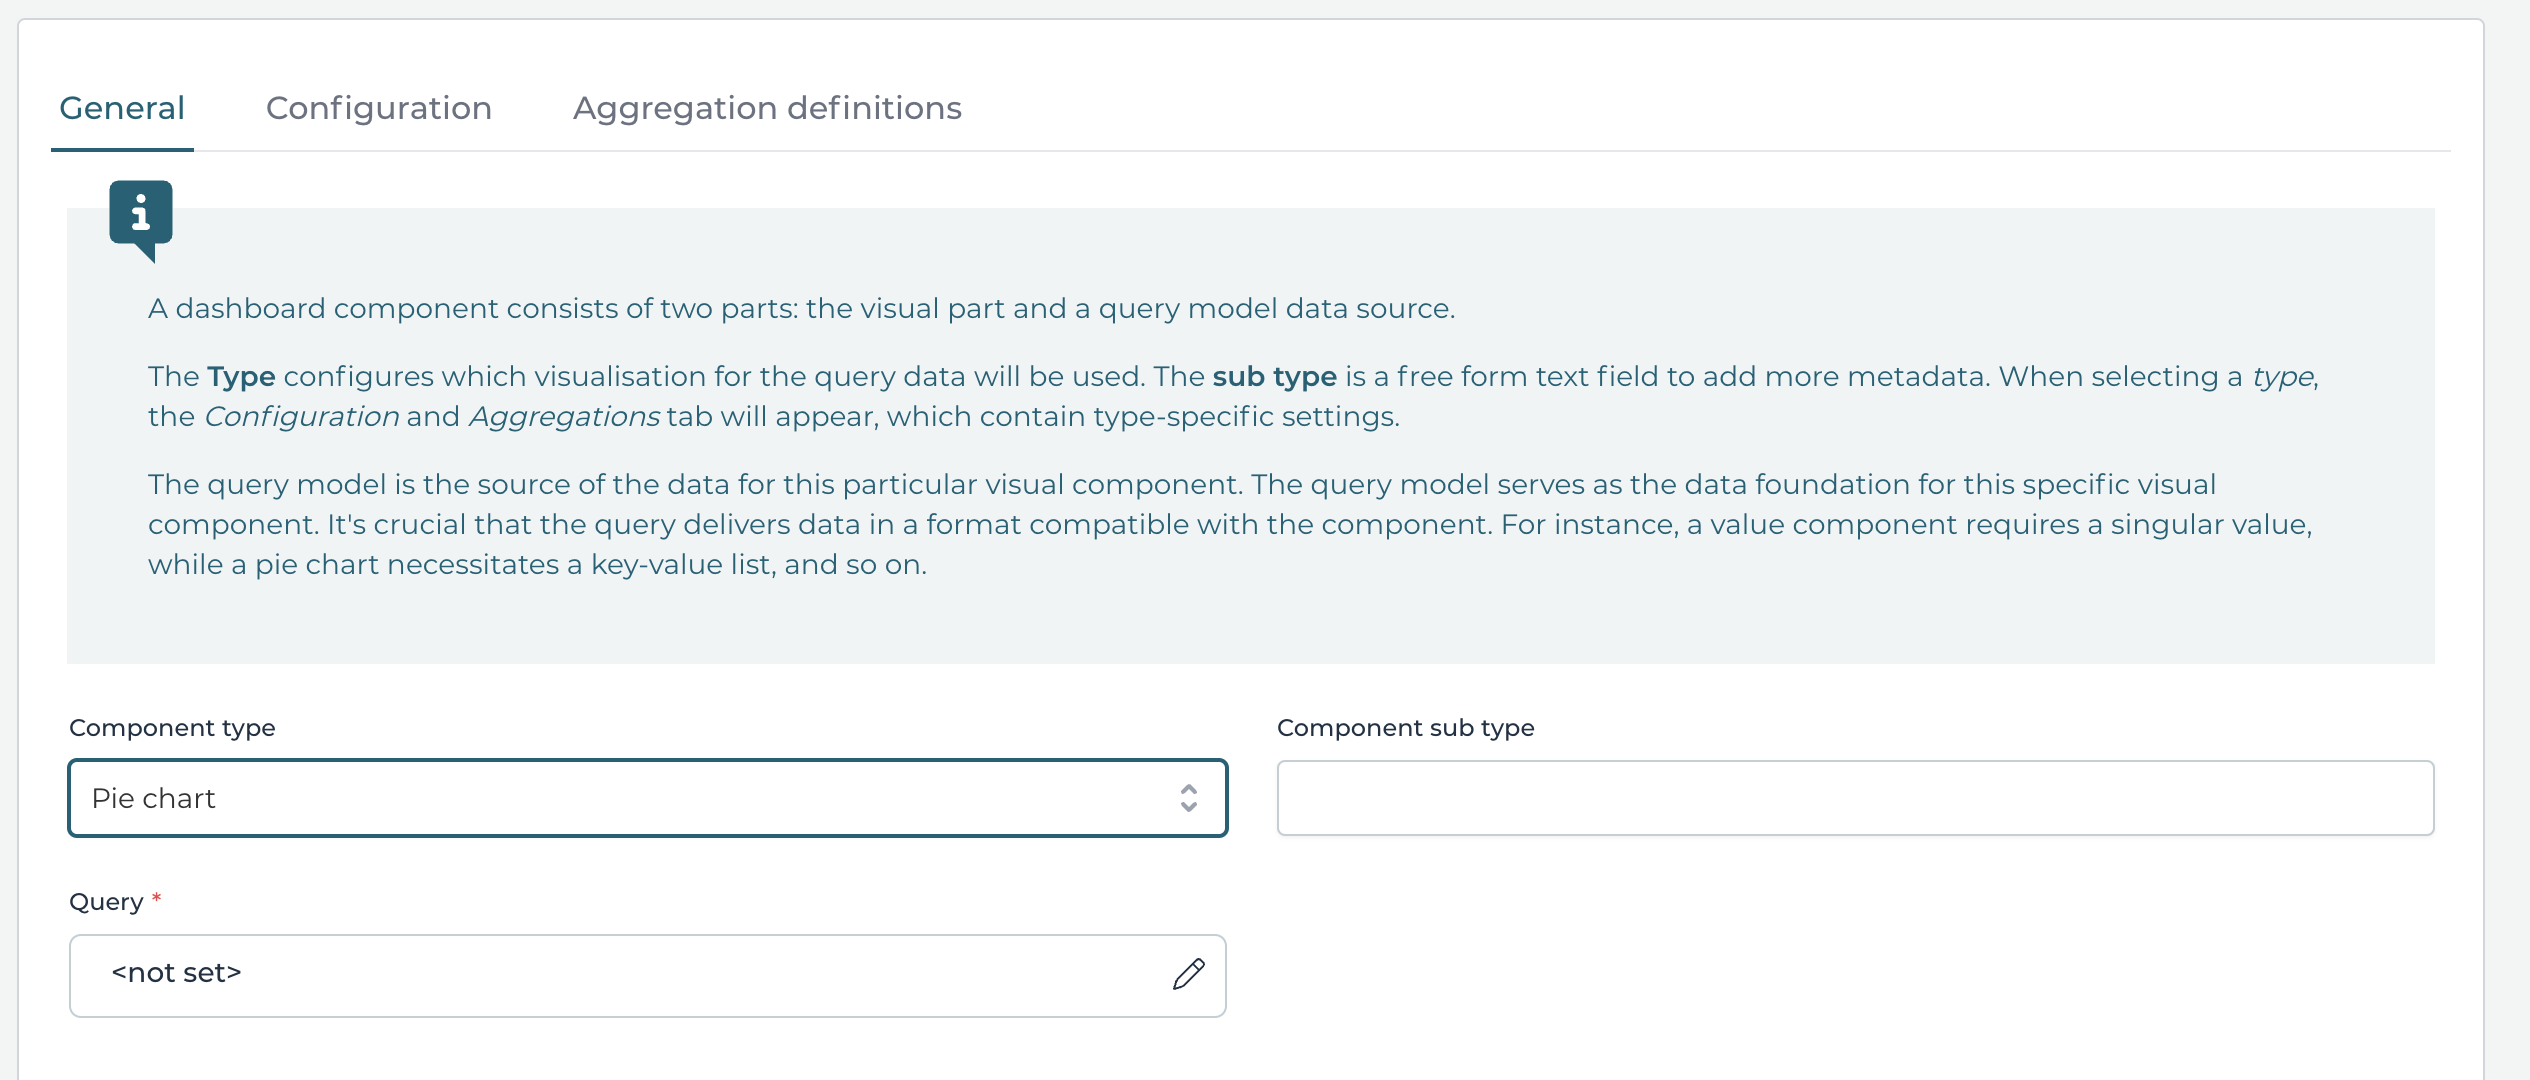
A dashboard component has two parts:
- The visual representation, determined by the Type of the dashboard component.
- The data source, which is handled by the linked Query model.
Type and Query
The Component type determines how the component is visualized. For example, we can use a pie chart, a line chart, a table, etc.
The Query then provides the data that needs to be visualized. There's a close relationship between the linked query and the type. For example, a pie chart can display data that is grouped in key-values, but it can't display tabular data. Make sure that the query used exposes the data in a format usable by the dashboard component.
Once a type is selected, the Configuration tab and Aggregation tab might be displayed if the type needs or supports it.
See the subsequent reference guides for more details.
 note
noteCurrently, only query models created with the query builder can be linked.
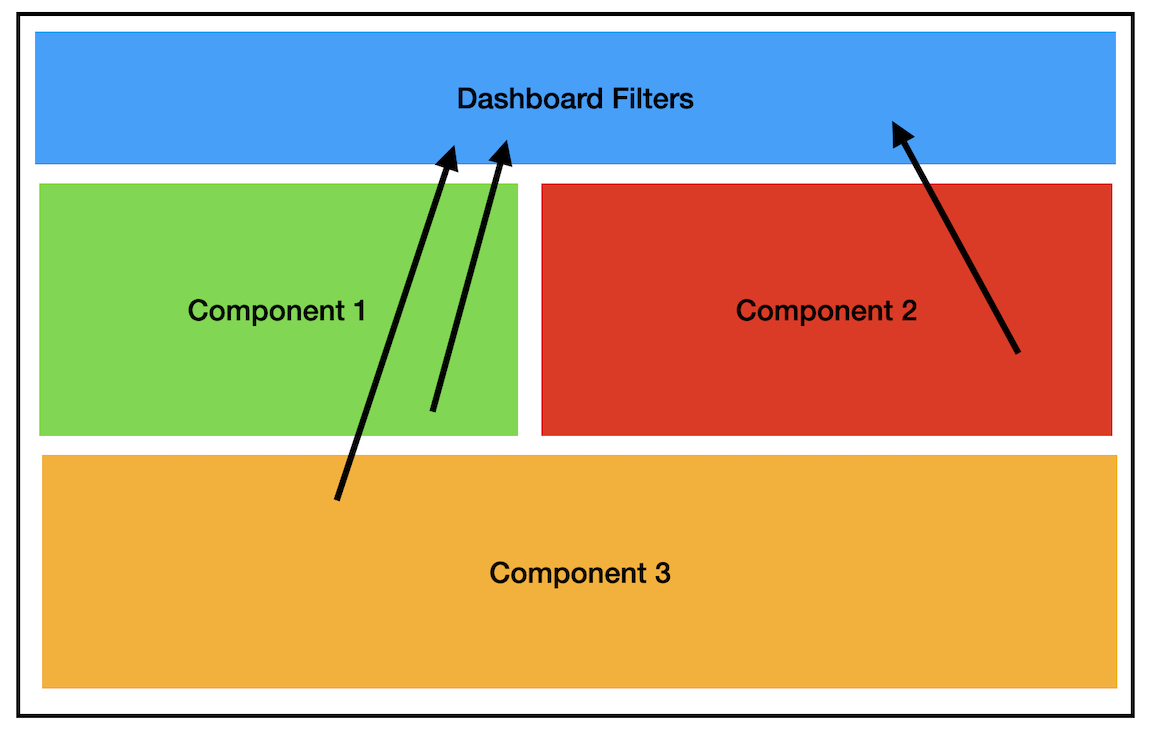
Parameters and the Dashboard Header
One thing of notice is that a dashboard component does not have any input parameters, which is odd as the referenced query that's used as data source does have input parameters.
Instead, the dashboard component implicitly inherits all dynamic parameters that are part of the referenced query model. Input parameters with the same name are automatically rendered as one input component.
When changing a value in this header, all dashboard components that use that filter will re-fetch their data using the new values.
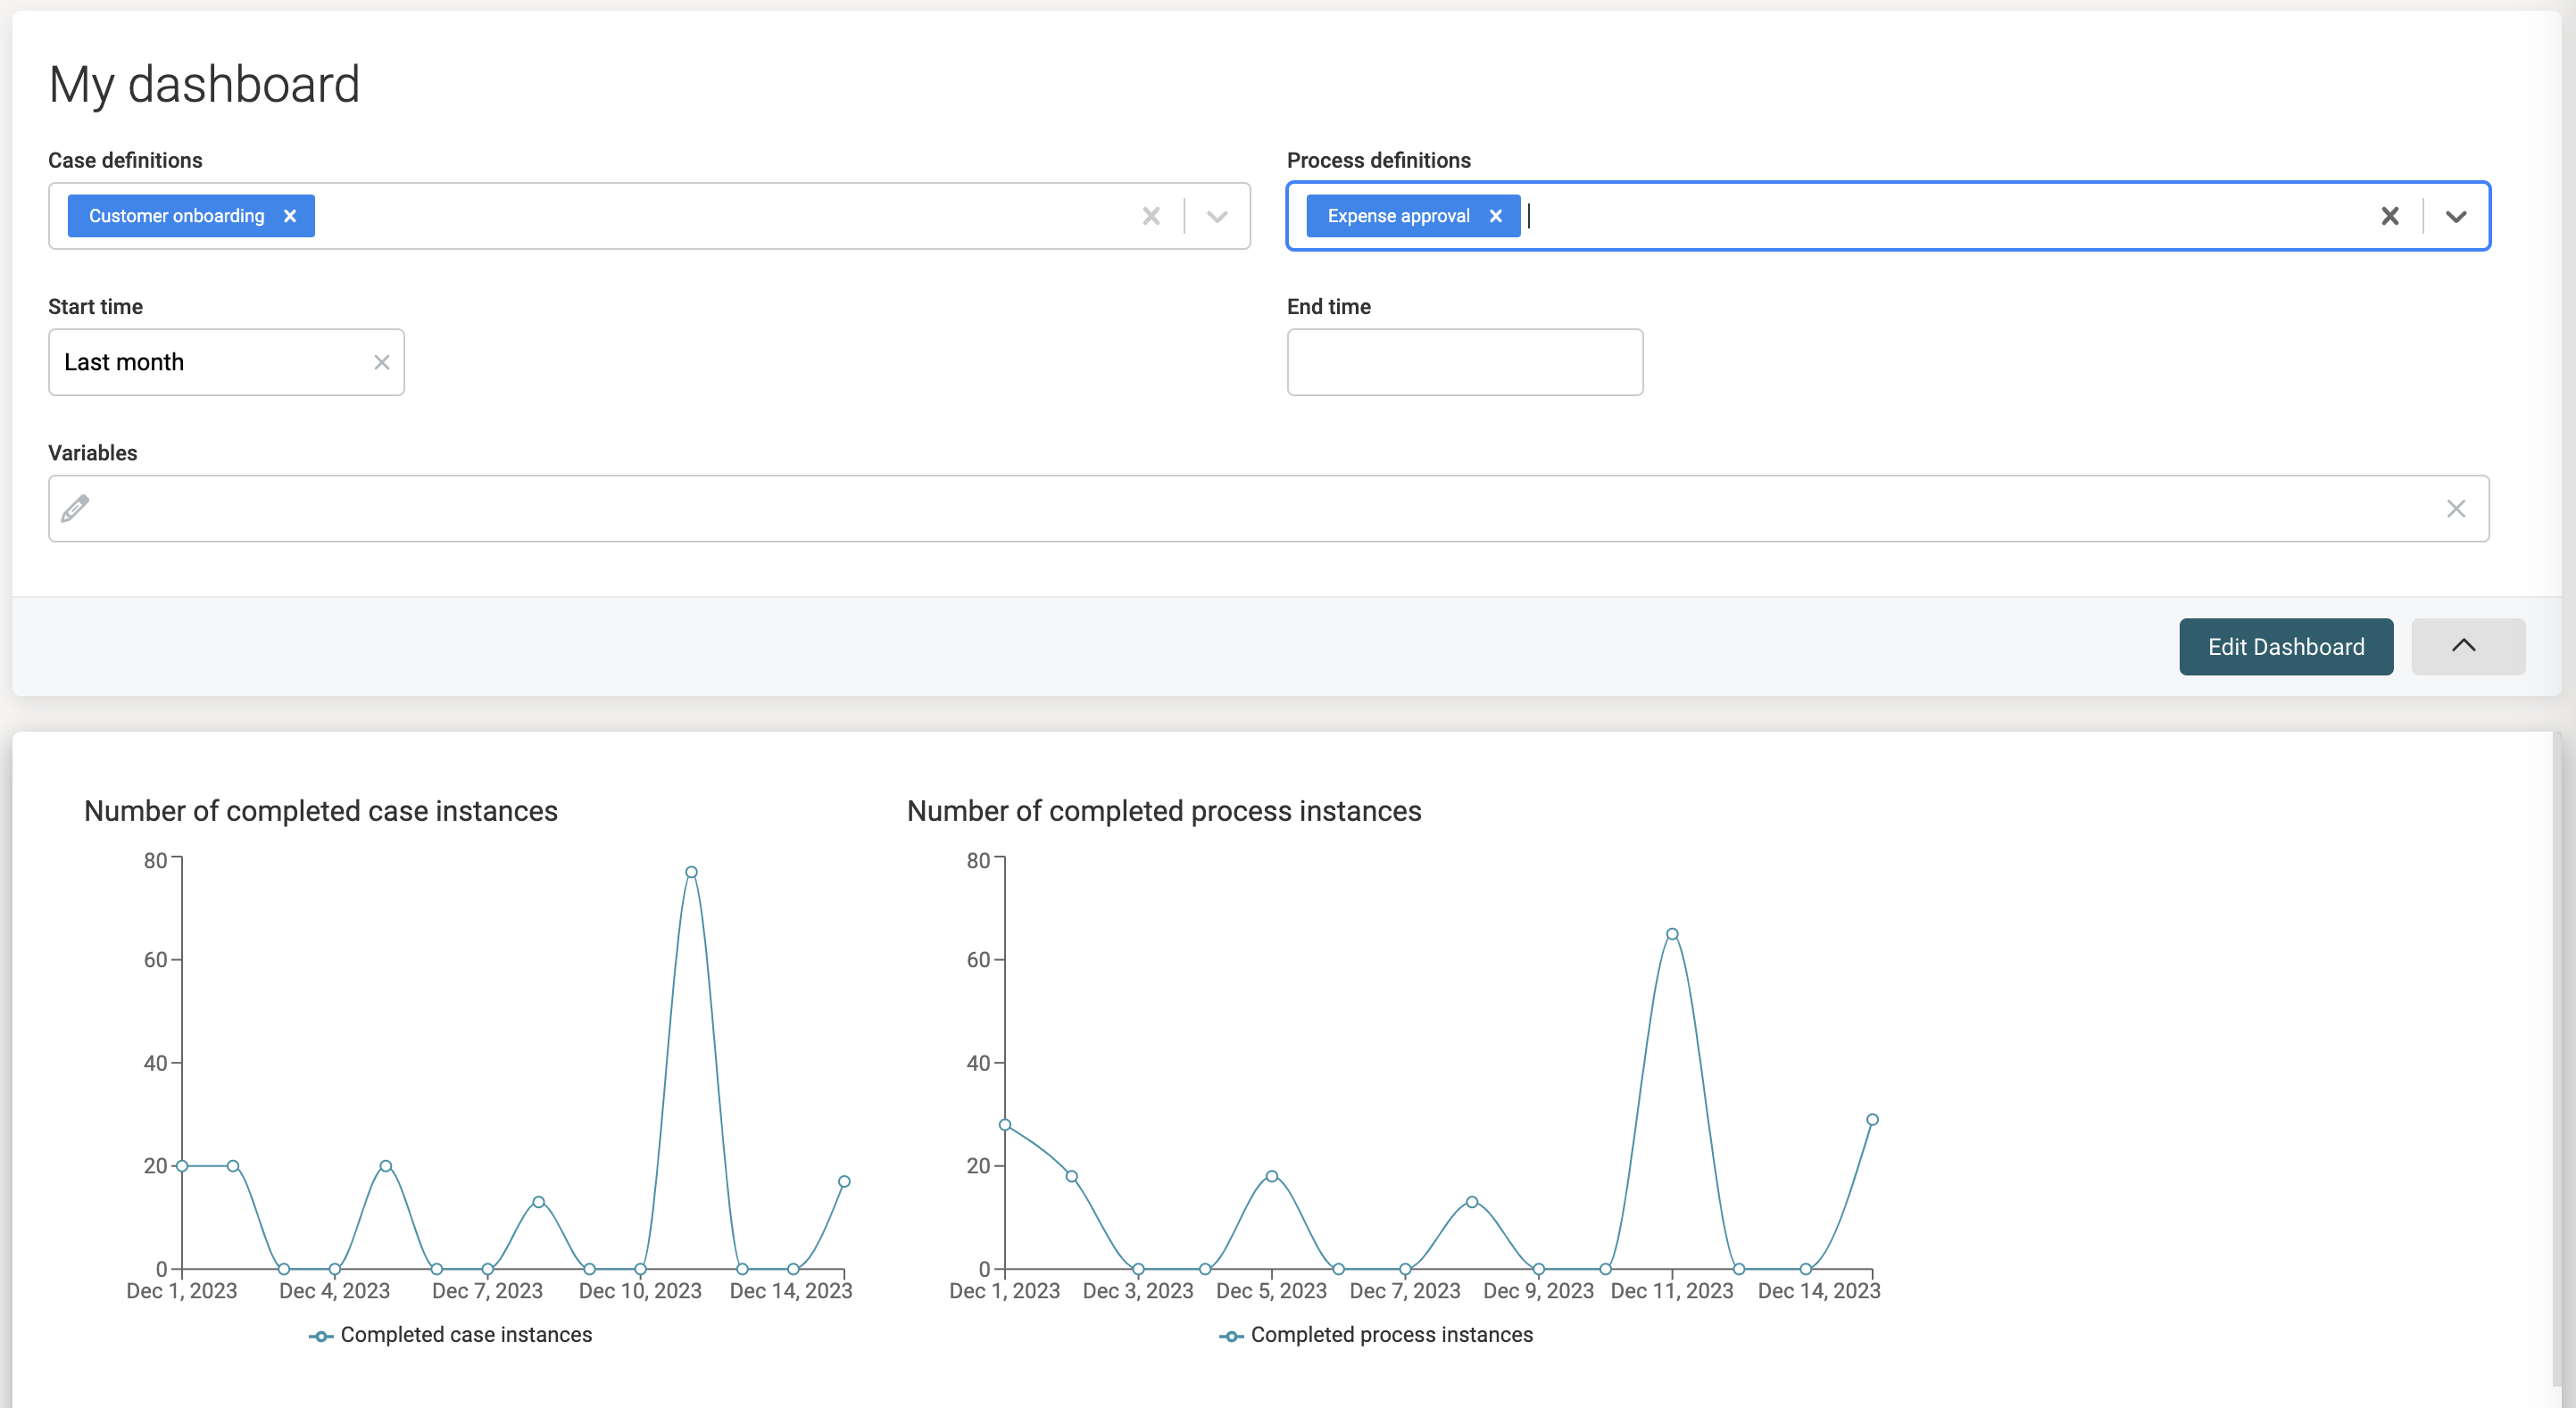
For example, the next screenshot shows two dashboard components that both have a different query as data source. The queries however, have the same set of five parameters (dynamic process/case/start time/end time and variables) but only one element of each is rendered:
v3.15.0+ In version 3.15.x, query models from the query builder did not have input parameters. The dashboard component implicitly got parameters based on the chosen filters. Furthermore, when two or more dashboard components shared a dynamic parameter and were added to the same dashboard, there was only one entry added to the dashboard header.