Monitoring
In the real world, different unforeseen failures can always happen. Luckily, Flowable provides you the flexibility in this area and allows to use the monitoring tools of your choice.
This guide gives you an overview over the different errors which can happen and how you can monitor them.
Involved Services and Systems
The following services and systems are used when you run Flowable Work, and like any system, can potentially fail:
- Hardware infrastructure of the host system: The server can crash, the reverse proxy you have goes down, or a simple network failure. There are multiple failures here which need to be considered.
- Relational Database of the Flowable application: A relational database is a requirement to run Flowable. In case the relational database is down or unreachable, a Flowable installation can't execute any cases or processes anymore.
- Elasticsearch/OpenSearch for searching cases and processes: Flowable builds a search index which is used when query data. In case the index is not reachable the search and task lists are impacted. This service is optional and can be potentially disabled.
- Content Storage of Flowable Work: Files of Flowable Work are stored either in a database, on the file system, or for example on an external storage (like AWS S3).
- External Services used in Flowable models: Often, Flowable models are about integration and orchestration. The services might include REST-based services, as well as event based services and an event hub. They might be unreachable, return slowly or fail in other ways.
- Identity Provider for single-sign-on or LDAP: Users need to authenticate and often the authentication is done with a central system. In case this system is not responding, this might impact the Flowable application itself.
- Flowable Work is the core of the case and process execution. In addition to monitor the typical system metrics, you can also monitor the connectivity to the before mentioned services. It also needs to be considered to monitor Flowable specific metrics like for example dead letter jobs.
- Apps in Flowable which deliver the business value: The most important part are the apps which are executed in Flowable. Typically there are business constraints or business-specific errors that can be monitored and detected preferable as early as possible.
The sections below will focus on monitoring the last two bullet points. The first points are separate products on itself, please check the documentation of the used product for guidance on monitoring.
Monitoring Tools
There are different tools available to monitor the Flowable application. This includes, but is not limited to:
- Computer system and network monitoring tools, e.g. HTTP up checks
- A monitoring tool such as Prometheus (https://prometheus.io/): Metrics of the Flowable application
- Cloud Provider Monitoring Tool: Tied to your cloud provider
 note
noteFlowable is optionally using Elasticsearch / OpenSearch. The Elasticsearch stack offers monitoring capabilities as well which can be used to monitor Flowable. However, consider this carefully since Flowable is using Elasticsearch as a search platform, and not as a monitoring platform. In case your Elasticsearch is impacted by a downtime your monitoring might not notify you in case of Flowable is down, since Flowable depends on Elasticsearch.
Metrics to Monitor Flowable
In Flowable applications you have different metrics. There are some metrics which you should monitor to ensure that your system keeps working over a long time. The following list provides some metrics which you can consider to monitor. To decide which metrics are important consider your use-case.
Infrastructure metrics examples:
- Validity of SSL certificates: SSL certificates expire eventually. Ensure that you renewed them automatically, or you get notified early enough to renew them manually.
- Available disk space: Documents are stored, temporary files are created. Ensure that you are aware how much space is left for the different applications and cleanup or create additional disk space.
- Database size: When the database is growing in GB of data, housekeeping or history configuration might be beneficial to only keep the data required.
- CPU usage: Is the CPU usage too high, you might have an issue, or you need to scale up.
- Memory usage: Running close to the maximum allocated memory or running out of memory might indicate either memory intensive operations in your process/case, or that you do not have enough resources.
Flowable metric examples to monitor current health:
- Health endpoints: Flowable provides actuator health endpoints (e.g.
/actuator/health). This is an easy way to figure out if the application is healthy. It also provides basic monitoring for other systems Flowable requires (e.g. LDAP when configured). - Deadletter jobs: Jobs in Flowable might fail. Those could be either technical (e.g. history jobs) or business related (e.g. asynchronous jobs).
- Rejected jobs: In case your node is overloaded, you will have rejected jobs. Either you have unusual high load, and you need to reduce the incoming traffic, or it's time to scale. Rejected jobs are an indicator that at least one node is not able to keep up. Check-out also the how-to about performance tuning.
- History jobs: The number of history jobs is typically small, which allows the system to complete them quickly. A large number of history jobs is an indication that the system is not able to handle the load in the speed in which new history jobs are created.
- HTTP Status code: In case you have status codes with 500 or higher, you might have problems with your data or model. Check the logfile for further details.
- Error logs: An error in the logfile indicates that something went wrong. However, experience has shown that it's hard to distinguish if this is an infrastructure related error or a business error based on mistakes in the model.
- Validity of Flowable License: Your flowable license will expire eventually, and you won't be able to create new instances. Even if you will get notified by your Customer Success Manager and might receive (according to your contract) a new license, be aware of the expiration date of your current license. Double check after uploading the new license that the license was applied.
Potential metrics to get insights before errors:
- Process/case instances created: Typically, you have an expected throughput for your business use cases. When the number of process or case instances is either lower or higher this could indicate a technical or business problem.
- Number of executed operations: Similar to the process or case instances created, you can detect different behaviour through the number of executed operations. There are typically more executed operations than executed process/case instances.
- Number of executed REST requests: This number gives insights about how the application is used from a user point of view. When the number is lower than expected, it might be that there is a network connectivity or proxy issue towards your Flowable server.
- Number of created tasks: User driven processes often create tasks. The number of this metric might be overall stable throughout working days. In case this number drops, you have an indicator that something is wrong in the application.
- Duration of automated processes: Another business unit which gives you insights in how processes behave. In case the duration gets higher, you might have a bottleneck. You can look at diagrams like heatmaps and compare the execution for single steps over time.
- Used database connections: An exceptional high usage of database connection might indicate a higher load.
- Threads: For example the async executors do have a thread pool. When this thread pool comes close to the maximum size, you might need to scale to cope better with future workloads.
- External events received: In case you are working event based system, and you are expecting an overall constant workload, this is a metric which tells you how healthy your application works. Exceptional high number of events received might be that you are doing retries. Exceptional low numbers could be caused by events which are not delivered either from Flowable or by other systems.
- Active users: The number of users over a certain time period might be constant for your use-case. An exceptional drop might happen either on public holidays or in case users are no longer able to access the system.
This is just an overview over different metrics which you can use to monitor your system. For most projects it does not make sense to monitor all the metrics above. However, you should think about which metrics are relevant for the specific use-cases you have.
Usage of Prometheus
Prometheus is an open-source monitoring solution which can be used together with Flowable.
It integrates for example well when you are using a Kubernetes based setup.
When enabled, Flowable provides the Spring Boot Actuator monitoring endpoint for prometheus at /actuator/prometheus.
To enable prometheus, you can use the following property:
management.metrics.prometheus.export.enabled=true
For the out-of-the-box application, the prometheus endpoint is only accessible for admin users.
If you want to disable permissions on the endpoint you can set one of the following properties to permit_all:
- Platform -
application.security.endpoint.prometheus - Design -
application.design.security.endpoint.prometheus - Control -
flowable.control.app.security.endpoint.prometheus
noteThese properties are only available for the out-of-the-box applications. If you are building your own application you have to configure it appropriately.
noteWhen using a customization project, you also need to include the prometheus dependency:
<dependency>
   <groupId>io.micrometer</groupId>
   <artifactId>micrometer-registry-prometheus</artifactId>
   <scope>runtime</scope>
</dependency>
You can use Grafana or Alertmanager to get notified about changes in the metrics returned.
A few useful metrics to get started:
- Up of a service:
up{service="flowable-work-production"}
- HTTP status codes:
http_server_requests_seconds_count{status=~"^(5.*)$",container="flowable-work-production"}
- Deadletter jobs:
flowable_jobs_async_total{type="deadletter",service="flowable-work-production"}flowable_jobs_external_total{type="deadletter",service="flowable-work-production"}flowable_jobs_timer_total{type="deadletter",service="flowable-work-production"}flowable_jobs_history_total{type="deadletter",service="flowable-work-production"}
- Error statements in the logfile:
logback_events_total{level="error",service="flowable-work-production"}
noteYour service name might be different.
Example
The following picture shows the monitoring of error messages over time:
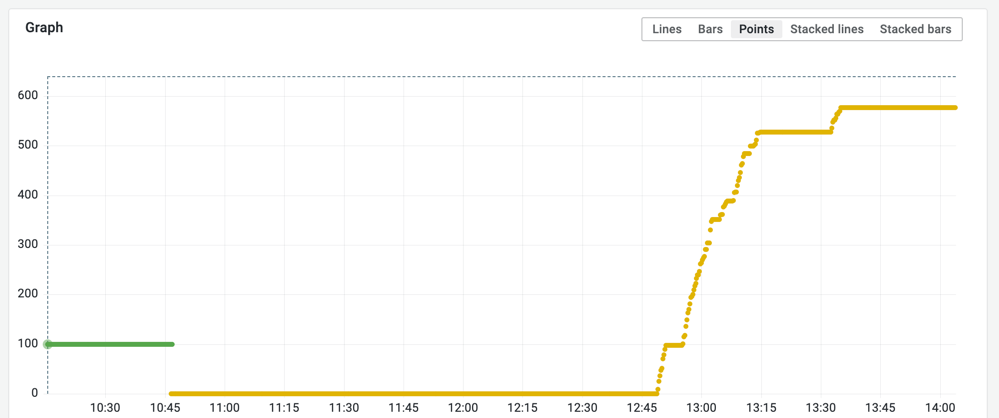
The switch from the green line to the yellow line indicates that a Flowable container was restarted. Once the new container started, the old container was terminated. Between 12:45 and 13:45 multiple new error logs were produced, while the system was healthy afterwards. Besides two breaks errors came in constantly over the time. Further steps to analyze the issue would be to look at the logfile for the provided time range.
Metrics Reference
The following is a list of all Micrometer metrics that Flowable exports.
In Prometheus format, dots become underscores and suffixes are added (e.g. flowable.jobs.timer becomes flowable_jobs_timer_total).
Common Tags
All Flowable metrics have the following tags applied:
| Tag | Description |
|---|---|
node | Set to flowable.node-name property value (if configured) |
application | Set to flowable.project-name or spring.application.name (defaults to flowable) |
Command Metrics
Controlled by flowable.metrics.command-enabled (default: true).
| Metric | Type | Tags | Description |
|---|---|---|---|
flowable.command.count | Counter | engineType | Commands executed per engine (bpmn, cmmn, dmn, platform, etc.) |
flowable.command.job.execution | Timer | engineType, type (async / history) | Async and history job execution timing |
Job Lifecycle Metrics
Controlled by flowable.metrics.job-enabled (default: true).
| Metric | Type | Tags | Description |
|---|---|---|---|
flowable.jobs.async | Counter | type (executed / failed / rejected / deadletter), tenantId | Async job lifecycle events |
flowable.jobs.timer | Counter | type (executed / failed / rejected / deadletter / scheduled), tenantId | Timer job lifecycle events |
flowable.jobs.history | Counter | type (executed / failed / rejected / deadletter), tenantId | History job lifecycle events |
flowable.jobs.external | Counter | type (executed / failed / rejected / deadletter), tenantId | External worker job lifecycle events |
Job Execution Observation
| Metric | Type | Tags | Description |
|---|---|---|---|
flowable.job.execution | Timer (Observation) | handler, scope.definition.id, scope.type (bpmn / cmmn / content / all / unknown), tenantId, type (async / timer / external / history / unknown). High cardinality: element.id, scope.id, subScope.id | Individual job execution duration with tracing integration |
Event Registry
Controlled by flowable.metrics.events-enabled (default: true).
| Metric | Type | Tags | Description |
|---|---|---|---|
flowable.event | Counter | eventKey | Events received through the event registry |
Instance Count
Controlled by flowable.metrics.instance-counts-enabled (default: true).
| Metric | Type | Tags | Description |
|---|---|---|---|
flowable.instance.count | Counter | tenantId, scopeType (bpmn / cmmn), scopeSubType (root / non-root) | Process/case instances started |
Task Executor Metrics
Controlled by flowable.metrics.executor-enabled (default: true).
These are standard Spring executor.* metrics renamed with a flowable.task. prefix.
The name tag identifies the executor: platformAsyncHistory, platformAsync, spring, flowableTaskInvoker, flowableTaskScheduler, contentAsync,
agentAsync.
| Metric | Type | Description |
|---|---|---|
flowable.task.executor.completed | Counter | Tasks completed per executor |
flowable.task.executor.active | Gauge | Currently active tasks |
flowable.task.executor.queued | Gauge | Tasks waiting in queue |
flowable.task.executor.queue.remaining | Gauge | Remaining queue capacity |
flowable.task.executor.pool.size | Gauge | Current pool size |
flowable.task.executor.pool.core | Gauge | Core pool size |
flowable.task.executor.pool.max | Gauge | Max pool size |
User Login
| Metric | Type | Tags | Description |
|---|---|---|---|
flowable.users.login | MultiGauge | user, tenantId | Active user logins (for license counting) |
AI Agent Metrics
Controlled by flowable.metrics.agent-enabled (default: true).
| Metric | Type | Tags | Description |
|---|---|---|---|
flowable.agent.invocations | Counter | agentDefinitionKey | AI agent invocations |
flowable.agent.promptTokens | Counter | — | Prompt tokens consumed |
flowable.agent.completionTokens | Counter | — | Completion tokens generated |
flowable.agent.totalTokens | Counter | — | Total tokens consumed |
flowable.agent.invocation | Timer (Observation) | agent.key, operation.key. High cardinality: agent.invocation.id | Agent invocation duration with tracing |
Service Registry
| Metric | Type | Tags | Description |
|---|---|---|---|
flowable.service.invokers.execution | Timer (Observation) | service.definition.key, service.operation.key, service.type (rest / script / expression / database), tenantId | Service invoker execution time |
Remote Script Execution
| Metric | Type | Tags | Description |
|---|---|---|---|
flowable.script.remote.execution | Timer (Observation) | outcome (success / bpmnError / businessError / cmmnFault / forbiddenError / illegalArgumentError / notFoundError / syntaxException / longRunningException / usageException / customException / requestException / unknownException / unknown), remote.version, script.language, tenantId. High cardinality: script | Remote script (JS sandbox) execution |
Elasticsearch Indexing
Controlled by flowable.observation.indexing.enabled (default: true).
| Metric | Type | Tags | Description |
|---|---|---|---|
flowable.elasticsearch.rest.client.requests | Timer (Observation) | index, tenantId, type. High cardinality: url | Elasticsearch REST client request duration |
flowable.elasticsearch.rest.client.bulk.data.send | Distribution Summary | index, tenantId | Bulk request payload size (bytes) |