ERD Diagram View
Introduction
Next to the standard type editor, the data dictionary editor offers an ERD (Entity Relationship Diagram) view: a visual representation of the complete data dictionary model. Where the standard editor works on one type at a time — showing the properties of the single type you have selected — the ERD diagram view renders all types of the model together as a diagram. This makes the overall structure of the model, and especially the relationships between its types, easy to grasp at a glance.
The diagram is a visualization and layout tool, not a second editor: types and properties are still created and edited in the standard editor. The ERD view is where you step back and look at (and lay out) the model as a whole, which is particularly valuable for larger data dictionaries with many types and references.
Opening the diagram
You switch to the diagram with the Entity diagram button in the data dictionary editor toolbar. It is a toggle: click it once to replace the standard editor with the diagram, and click it again to return to the standard type editor. While the diagram is shown, the expand all and collapse all toolbar actions — which only apply to the standard editor — are disabled.
What the diagram shows
Entities
Every data dictionary type is drawn as an entity: a box with a dark header showing the type's label, and the type's properties listed underneath. A type that has no properties (for example a type based directly on a value type) shows its underlying type in italics instead of a property list.
Properties
Each property is listed as a row inside its entity, with the property name on the left and its type on the right:
- Required properties are marked with a red asterisk (
*) in front of the name. - Value type properties show their value type on the right in grey — for example
StringorDouble. Array properties are shown with their item type in angle brackets, such asArray<String>. - Reference properties — properties whose type is another type in the same model — show the name of the referenced type on the right in blue, signalling that this row participates in a relationship.
Relationships
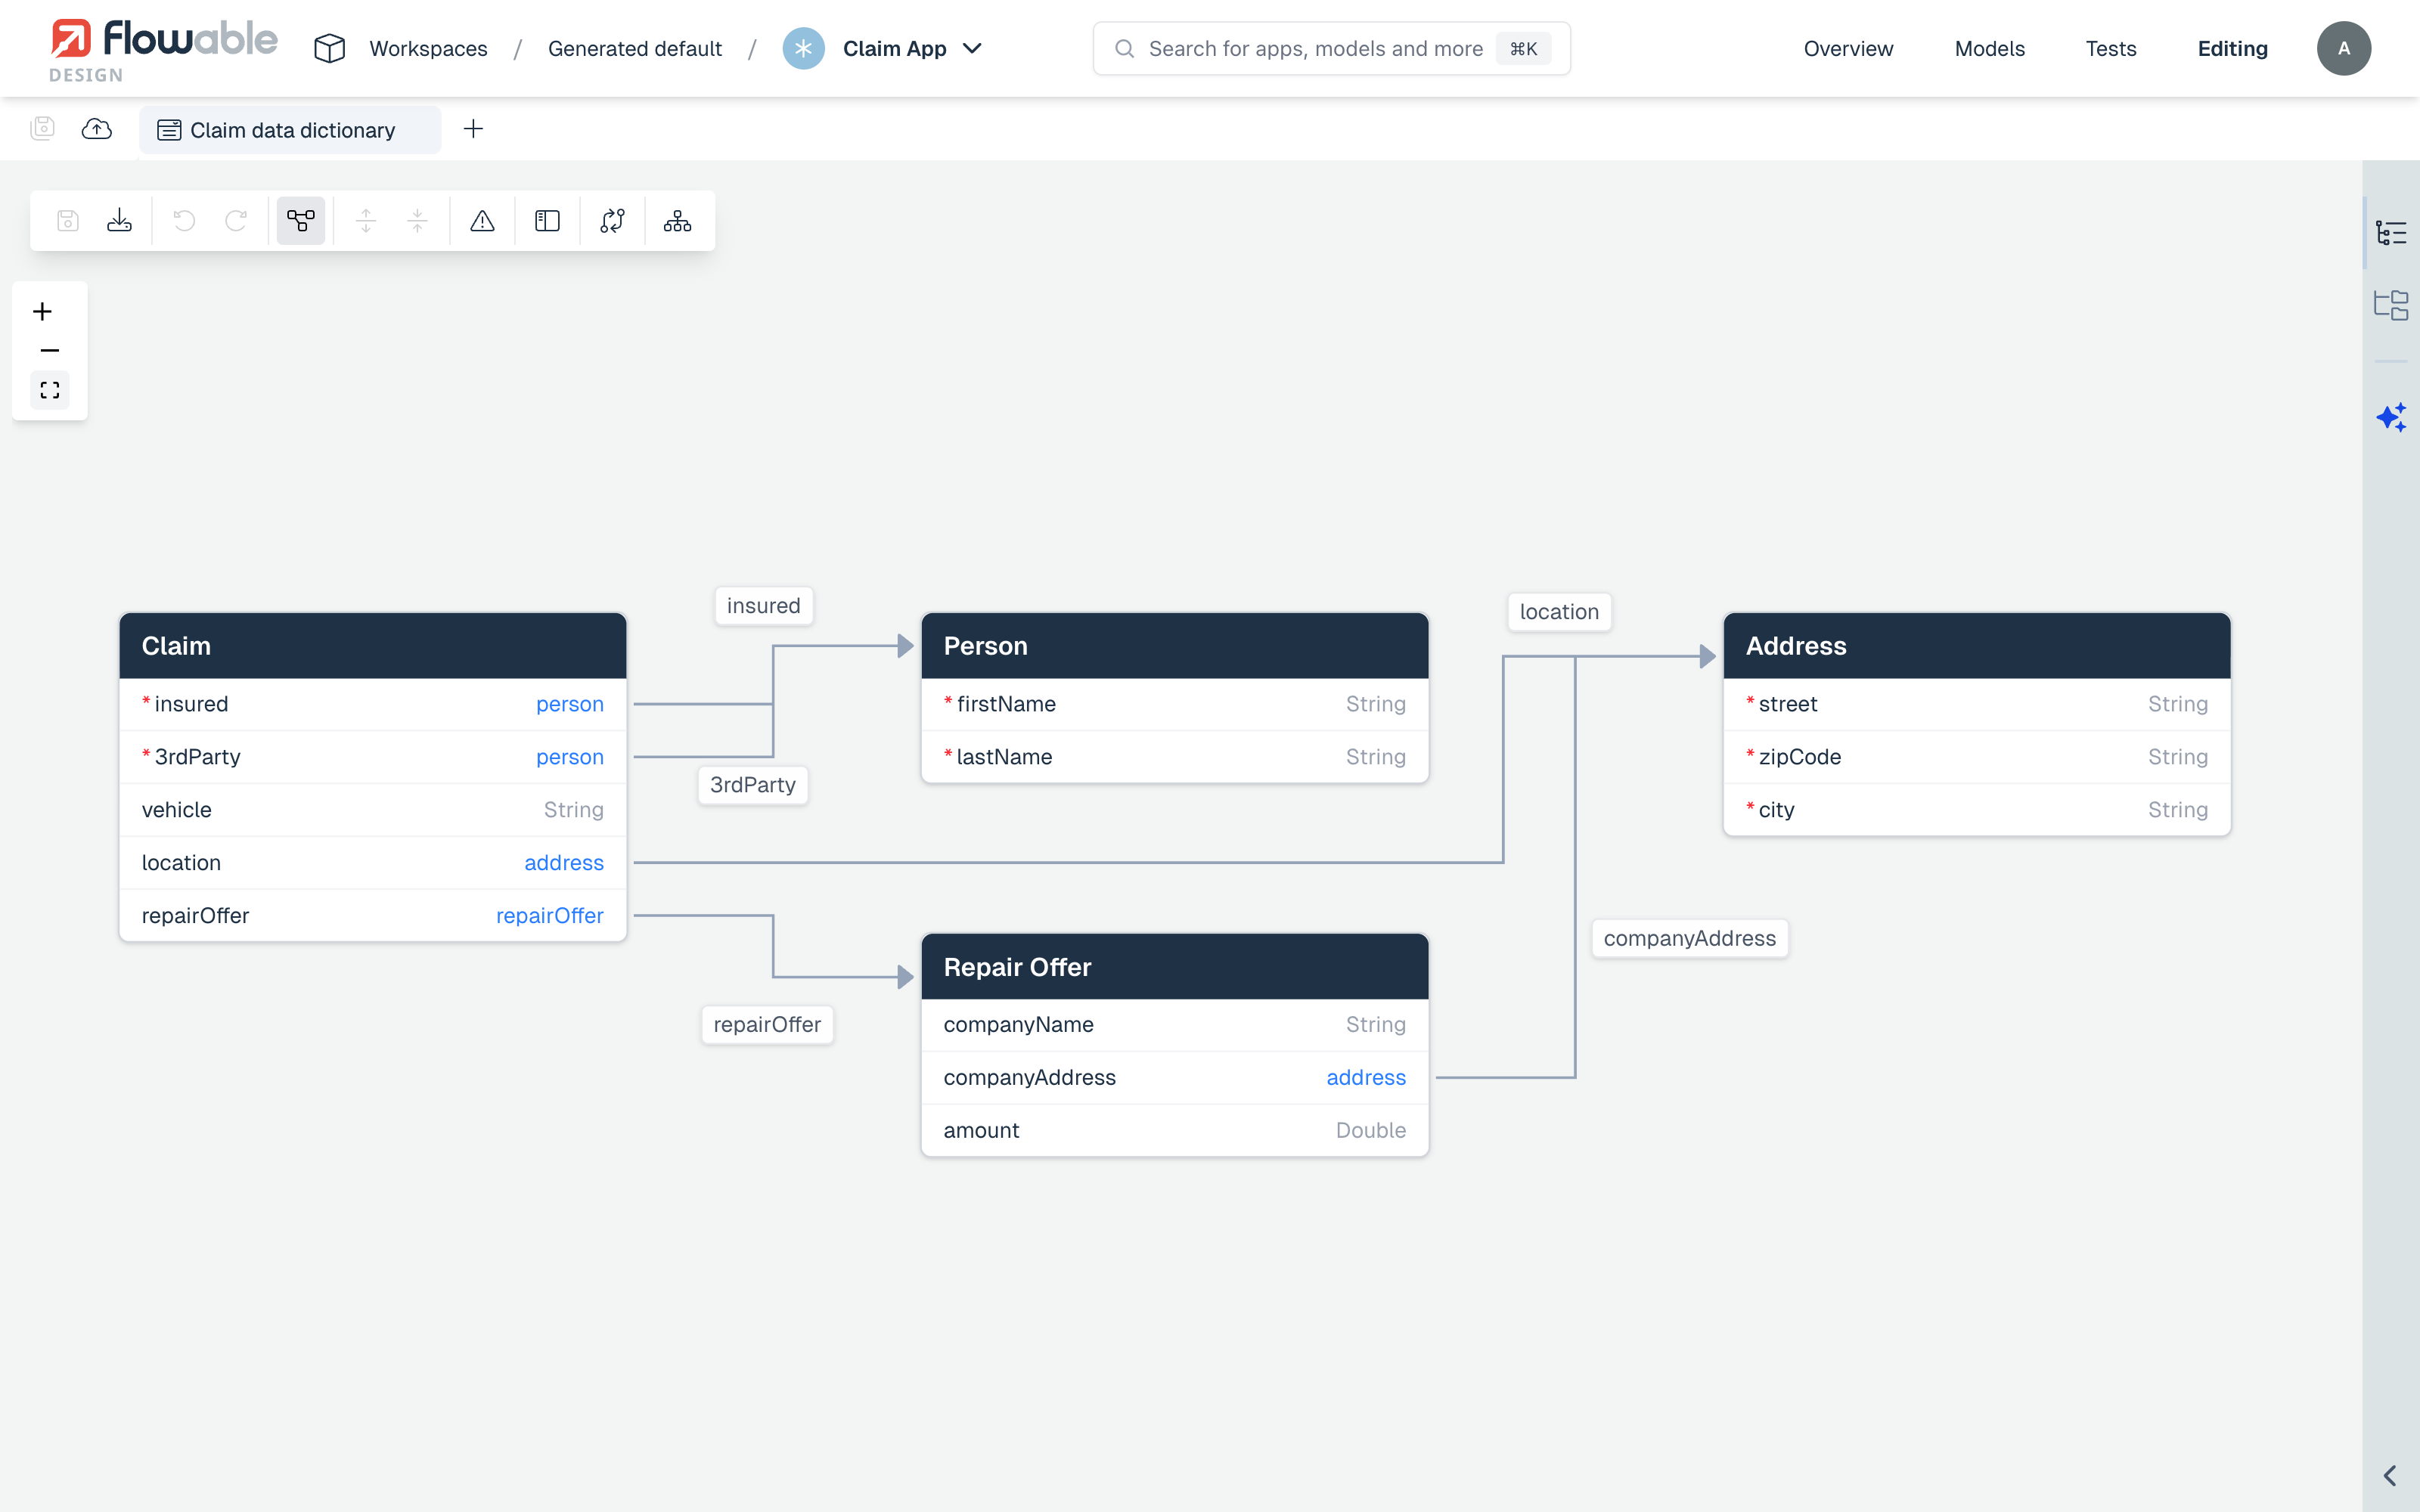
Every reference property is drawn as a directed connection from the property's row to the header of the referenced entity. The arrow points at the referenced type, and the connection is labelled with the name of the property that establishes the relationship. This makes it immediately clear not only that two types are related, but through which property.
Reading the example
The screenshot above shows the ERD diagram view of a Claim data dictionary model with four types — Claim, Person, Address and Repair Offer:
- The
Claimentity has the required value propertyvehicle(aString) and four reference properties:insuredand3rdPartyboth referencePerson,locationreferencesAddress, andrepairOfferreferencesRepair Offer. Each of these is drawn as a labelled arrow to the corresponding entity. - The
Personentity has the required value propertiesfirstNameandlastName. - The
Addressentity has the required value propertiesstreet,zipCodeandcity. - The
Repair Offerentity has the value propertiescompanyName(String) andamount(Double), and one reference property,companyAddress, that referencesAddress— soRepair Offerin turn has an arrow toAddress.
Reading the arrows top to bottom you can see the full shape of the model at once: a claim points at the people and address involved and at a repair offer, and that repair offer points back at an address.
Working with the diagram
The diagram is interactive:
- Pan and zoom the canvas by dragging the background and scrolling; the controls in the bottom-left corner let you zoom in and out and fit the whole diagram to the view. The diagram is automatically fitted to the view when you open it.
- Rearrange the entities by dragging them to new positions, and adjust how a relationship is routed by dragging its endpoints or its label. The layout you create — entity positions, connection routing and label positions — is stored together with the data dictionary model, so the diagram looks the same the next time the model is opened.
- Jump to a type by clicking its entity: the editor switches back to the standard view with that type selected, so you can edit its properties.
Because relationships in the diagram simply reflect the reference properties of your types, you add or remove them by adding or removing reference properties in the standard editor; the diagram updates to match.