Builder-based Query Model
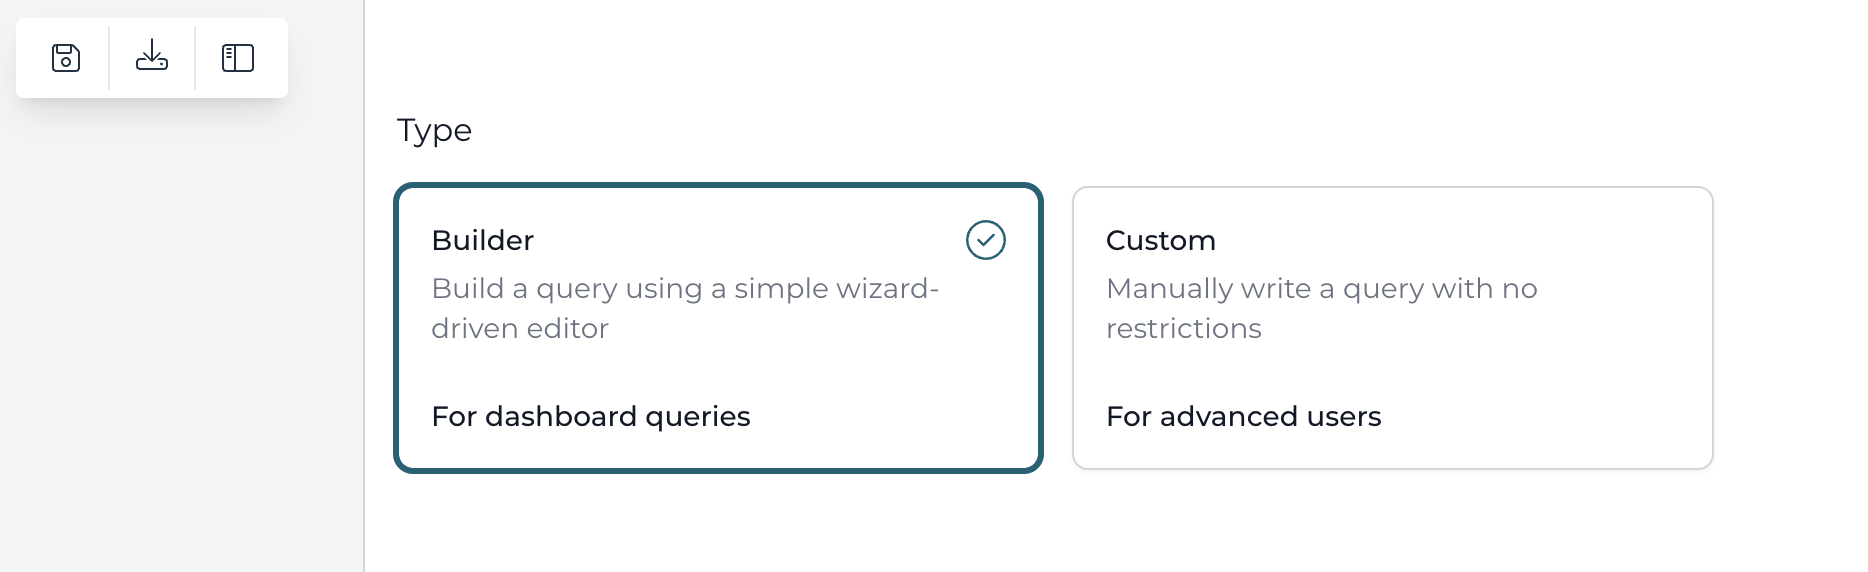
The goal of the Builder approach is to hide the low-level details and knowledge needed to create a query with a template. Instead of writing the Elasticsearch query directly, building blocks are selected and configured. This makes writing the query much easier and maintainable. However, it does mean that you are limited to the functionalities exposed by the query builder.
There are four tabs when selecting Builder on the top of the Query model editor: General, Filter, Query Result and Aggregations. this matches with how the query is conceptually executed:
- First, a filtering on the data is applied. For example, we only need process instances started last week.
- Second, we need to decide whether or not we need to return the actual data for this query. Often, we don't: for example when building a pie chart that groups process instances by their definition and does a count, we only care about those counts and not the actual instance data.
- Third, we apply aggregations on top of the filtered data. For example, taking the pie chart again, we apply a count by definition on the filtered process instances.
General
This tab contains some general settings for the query model.
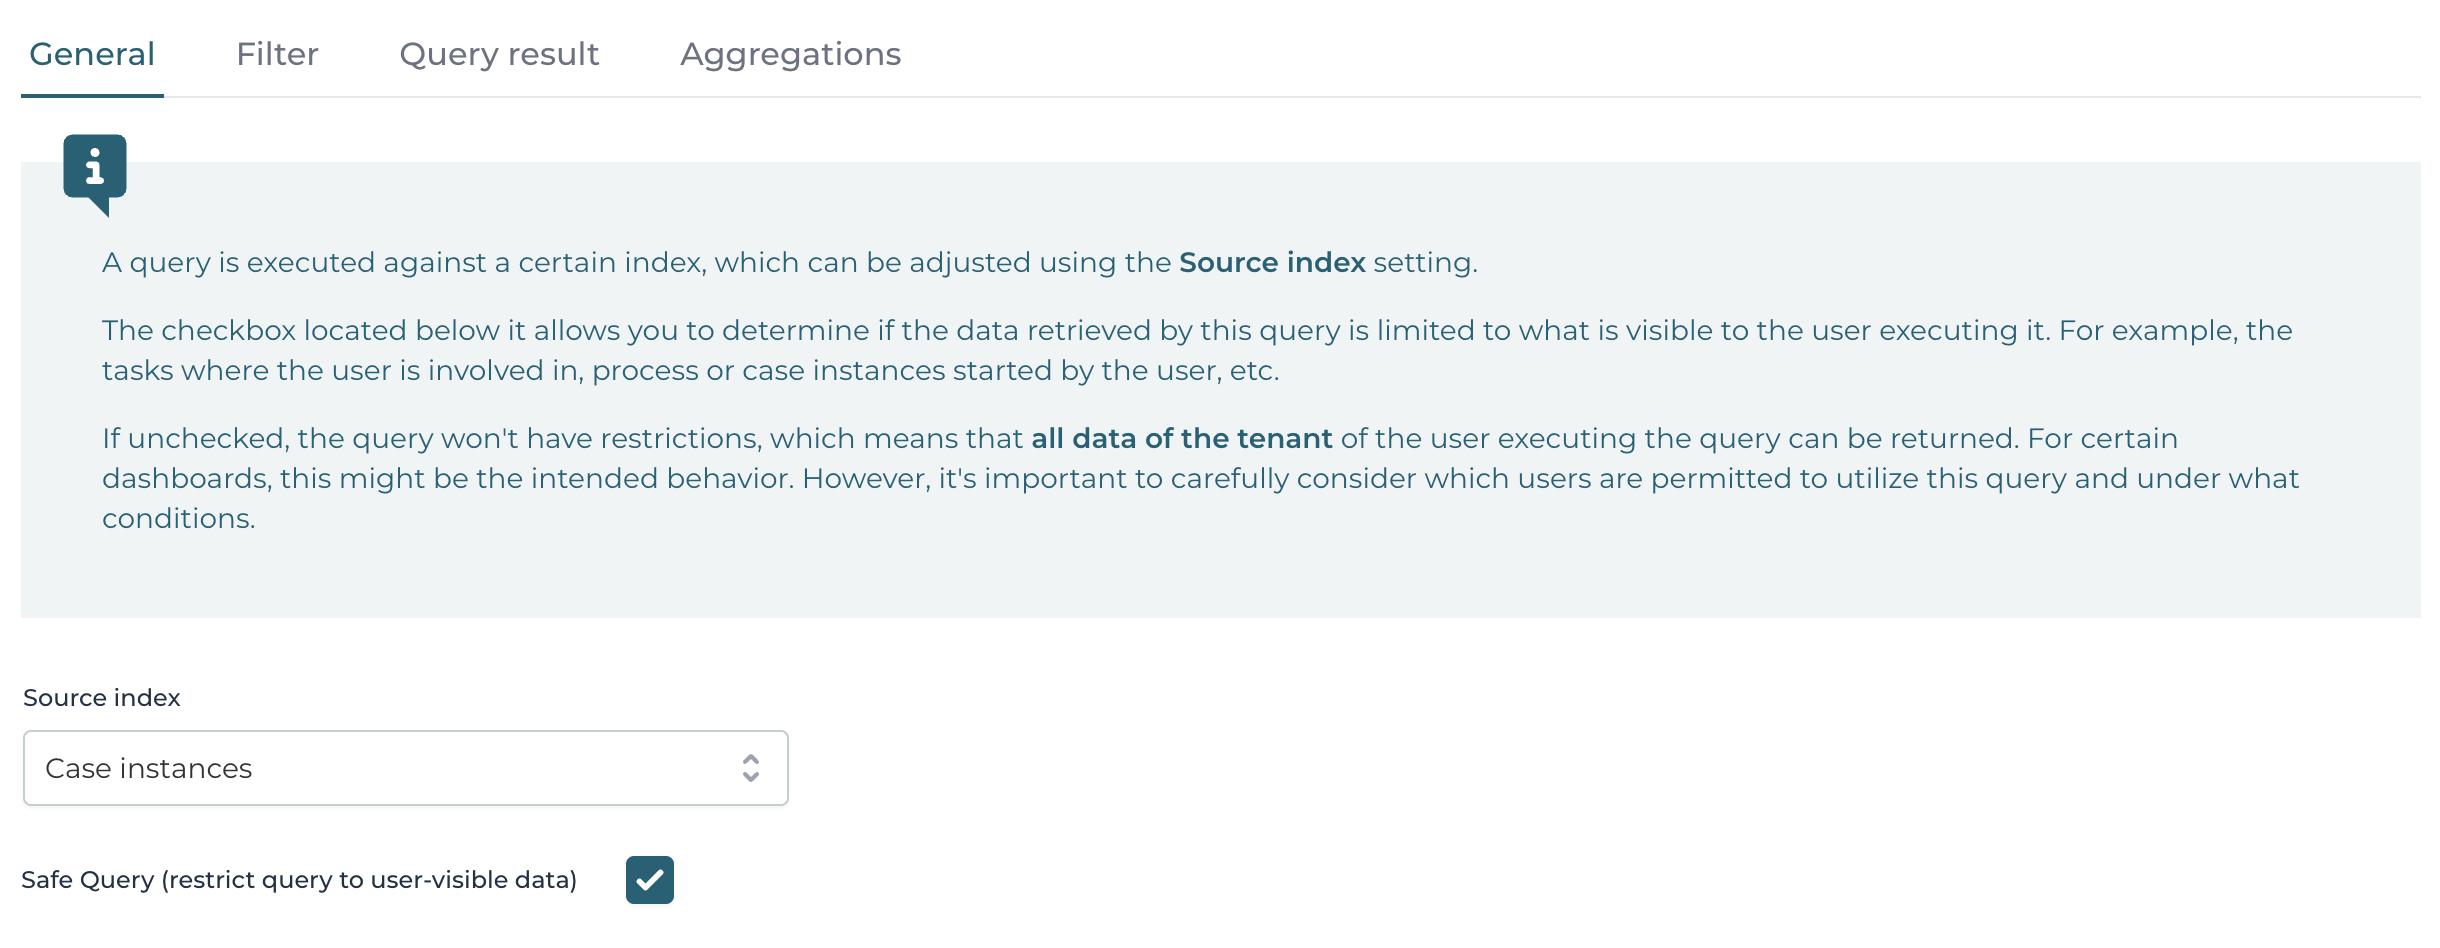
First of all, a Source Index needs to be chosen, against which the query will be executed at runtime.
Below it is whether the query is a safe query or not, see the concepts page for more details.
Filter
This is the main part of the query, where the filter is configured, which filters the data that is returned.
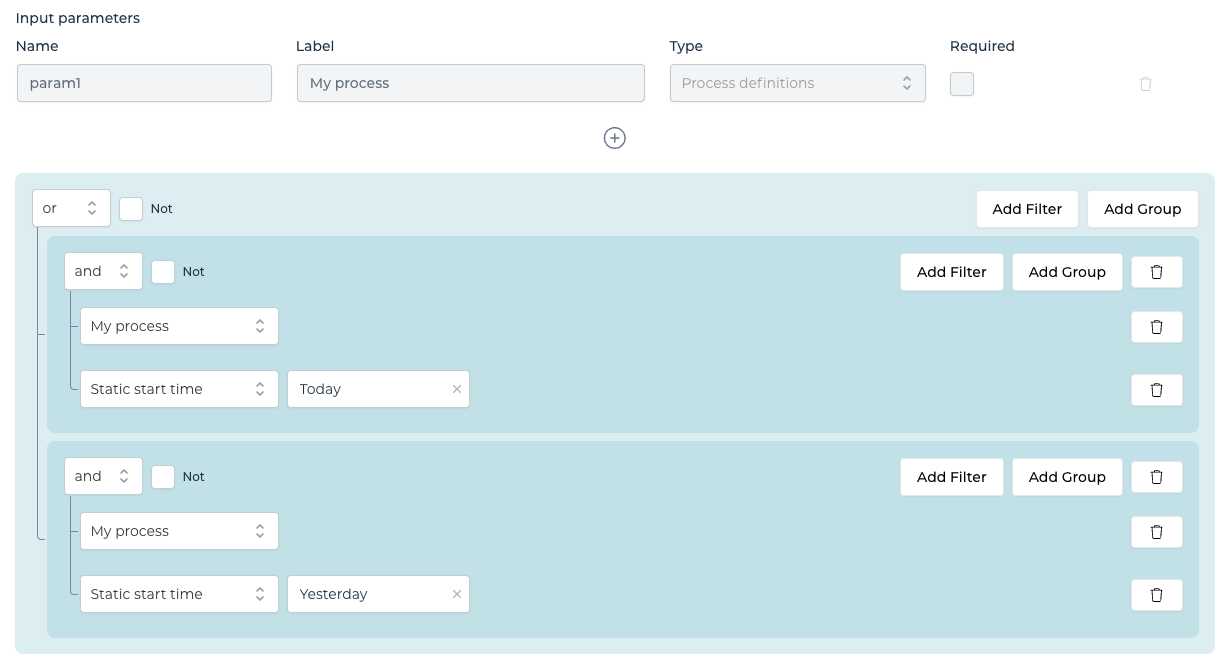
As shown on the screenshot above, a filter can be an arbitrary combination of ANDs, ORs that on their turn can be nested or inverted with a NOT.
There's a distinction here between dynamic or static filter parts.
Static is the easiest to explain: when used, this sets a hard-coded value. For example, the query could always be filtering on a specific process definition. This means that at runtime, no values are expected from the user to execute this particular part of the query.
The dynamic parts of the query are bound to the Input parameters. At runtime, a value for these parameters is expected and the values will be used to build up a dynamic query. For example, when using a process definition input parameter, a value (e.g. the process definition key) needs to be bound to provide an actual value. In the dashboard UI in Work, this means a process definition picker is rendered, while in a query data table, a binding with a textfield or dropdown can be made to provide a runtime value.
When it comes to input parameters and their types, there is a big difference in whether the query is used as a source for a dasboard component in the dashboards in Work or as a source for e.g. a query data table. Let's have a look the different types:
- Process or Case definitions: Renders a process or case definition picker in Work dashboards. In a query data table, string values are expected and will be used as keys for the definitions. Multiple definitions can be chosen, with OR semantics.
- Name: Renders a textfield to provide a text value in a Work dashboard. In a query data table binding, needs to be bound to a component that provides a string value. The semantics are following the 'like' paradigmn (more technical, wildcard search in Elasticsearch).
- Business key or Business status: Renders a textfield to provide a text value in a Work dashboard. In a query data table binding, needs to be bound to a component that provides a string value. The semantics are 'equals', i.e. an exact match.
- Active or Finished: Render a checkbox in a Work dashboard. In a query data table binding, needs to be bound to a component that provides a boolean value. When active is checked, only active instances will be returned. When finished is checked, only completed ones are returned. Unchecking them means that these restrictions are not applied to the query.
- Start and end time: Renders a date range picker in a Work dashboard. In a query data table, renders two fields that need to be bound. When only one field is bound, it needs to be a string value that can be any of the following:
yesterday | lastWeek | lastMonth | last3Months | lastYear. When two fields are bound, both fields need to provide a date value. - Variable condition builder (in older releases also named 'variables'): renders a variable condition builder in a Work dashboard that allows to build a complex condition based on variables to which the query needs to adhere to. Usage in a query data table is not supported, as the corresponding json format to express the conditions is too complex.
There's another important distinction for input parameters when it comes to dashboards and other usages such as the query data table:
- In a dashboard, all components sharing input parameters with the same type are merged into one parameters, as otherwise the header of the dashboard will become unwieldly. When doing the query, the value is then propagated to all parameters of the same type.
- In a query data table, all input parameters can be bound. Even if there are multiple parameters with the same type, all of these parameters can be bound to different values.
Query Result
A query model made by the query builder is used in dashboards. Often, the actual data isn't needed to be displayed. For example, for a pie chart, we're only caring about the aggregation of the data, but not the data itself.
That's why in this tab the Return results is unchecked by default.
However, when building for example a table to display data, this checkbox needs to be checked to return the actually filtered data.
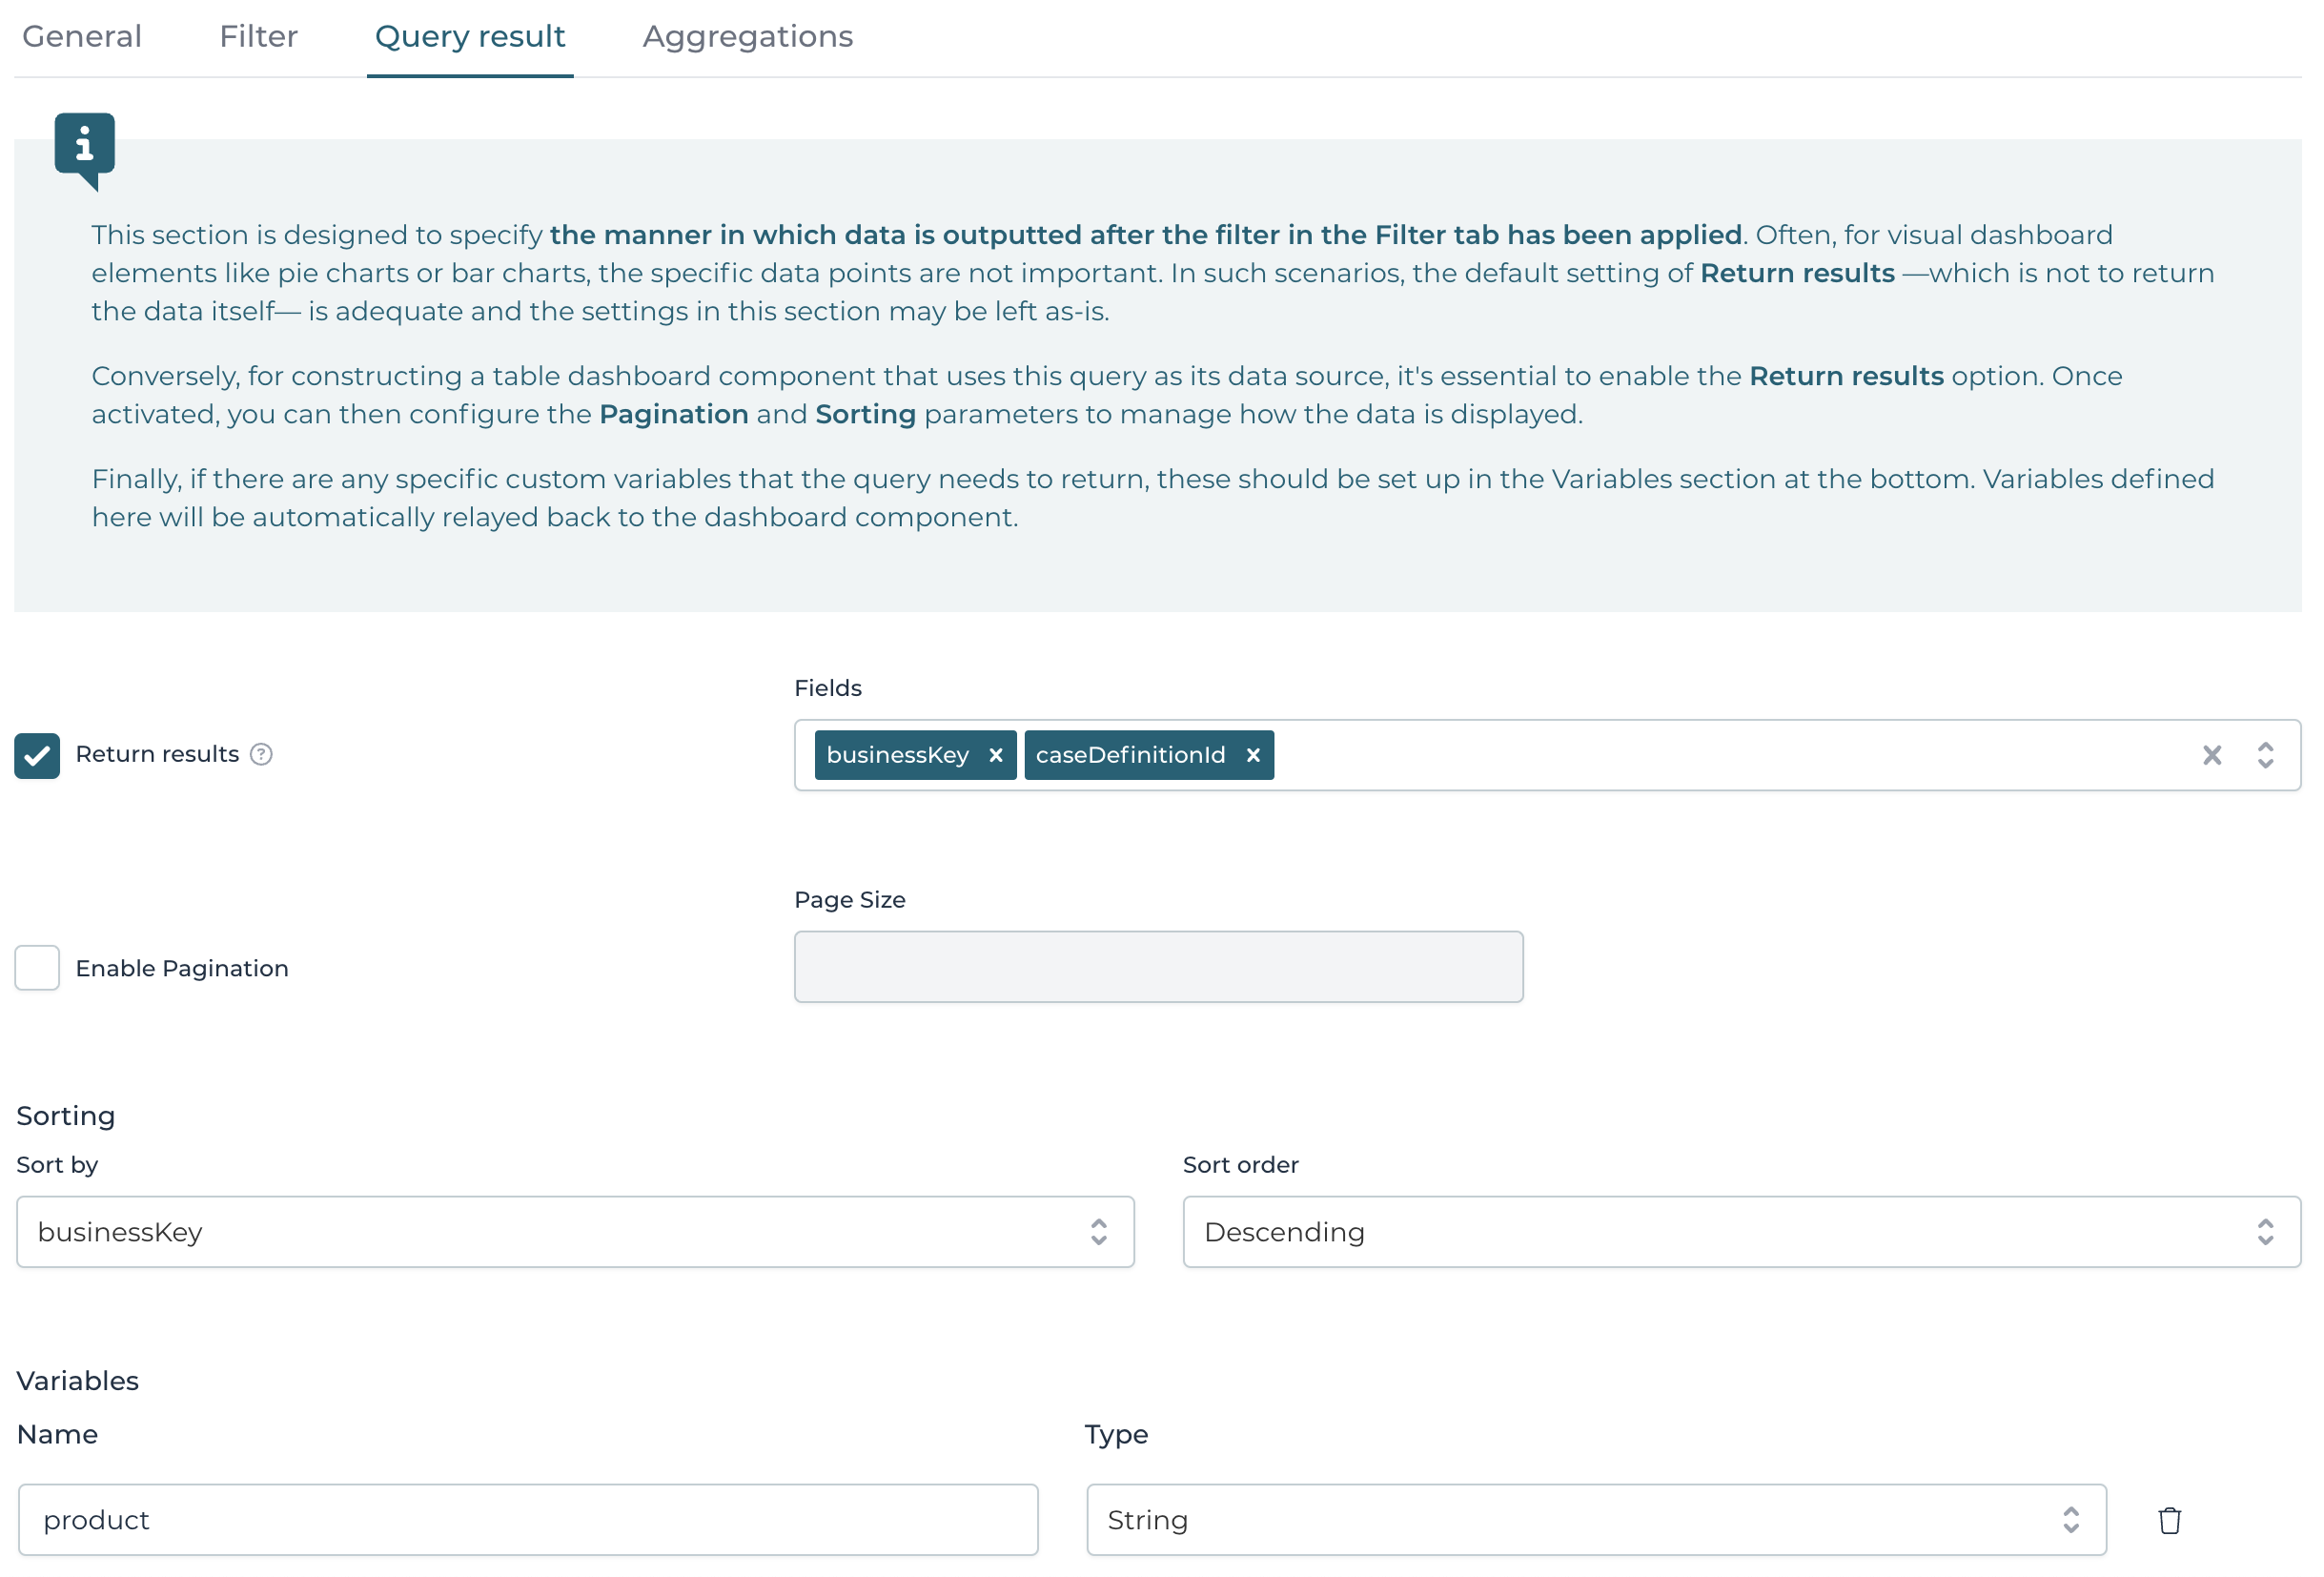
Once that checkbox is checked, it's possible to configure which Fields need to be returned by this query. Leaving this dropdown empty, will return all fields.
The Enable pagination is important, as it determines how many results are returned with each query execution. Make sure to configure a good default here, or a system might be slowed down when having to fetch and return too much data.
The Sorting allows to define how the data returned should be sorted.
The Variables allow to configure the names (and their types) of variables that should be returned for each result. For example, when retrieving process instances, we also want to retrieve some variable values on top of it. When building a table dashboard component with this query as source, this is important as these variables are then available to be displayed.
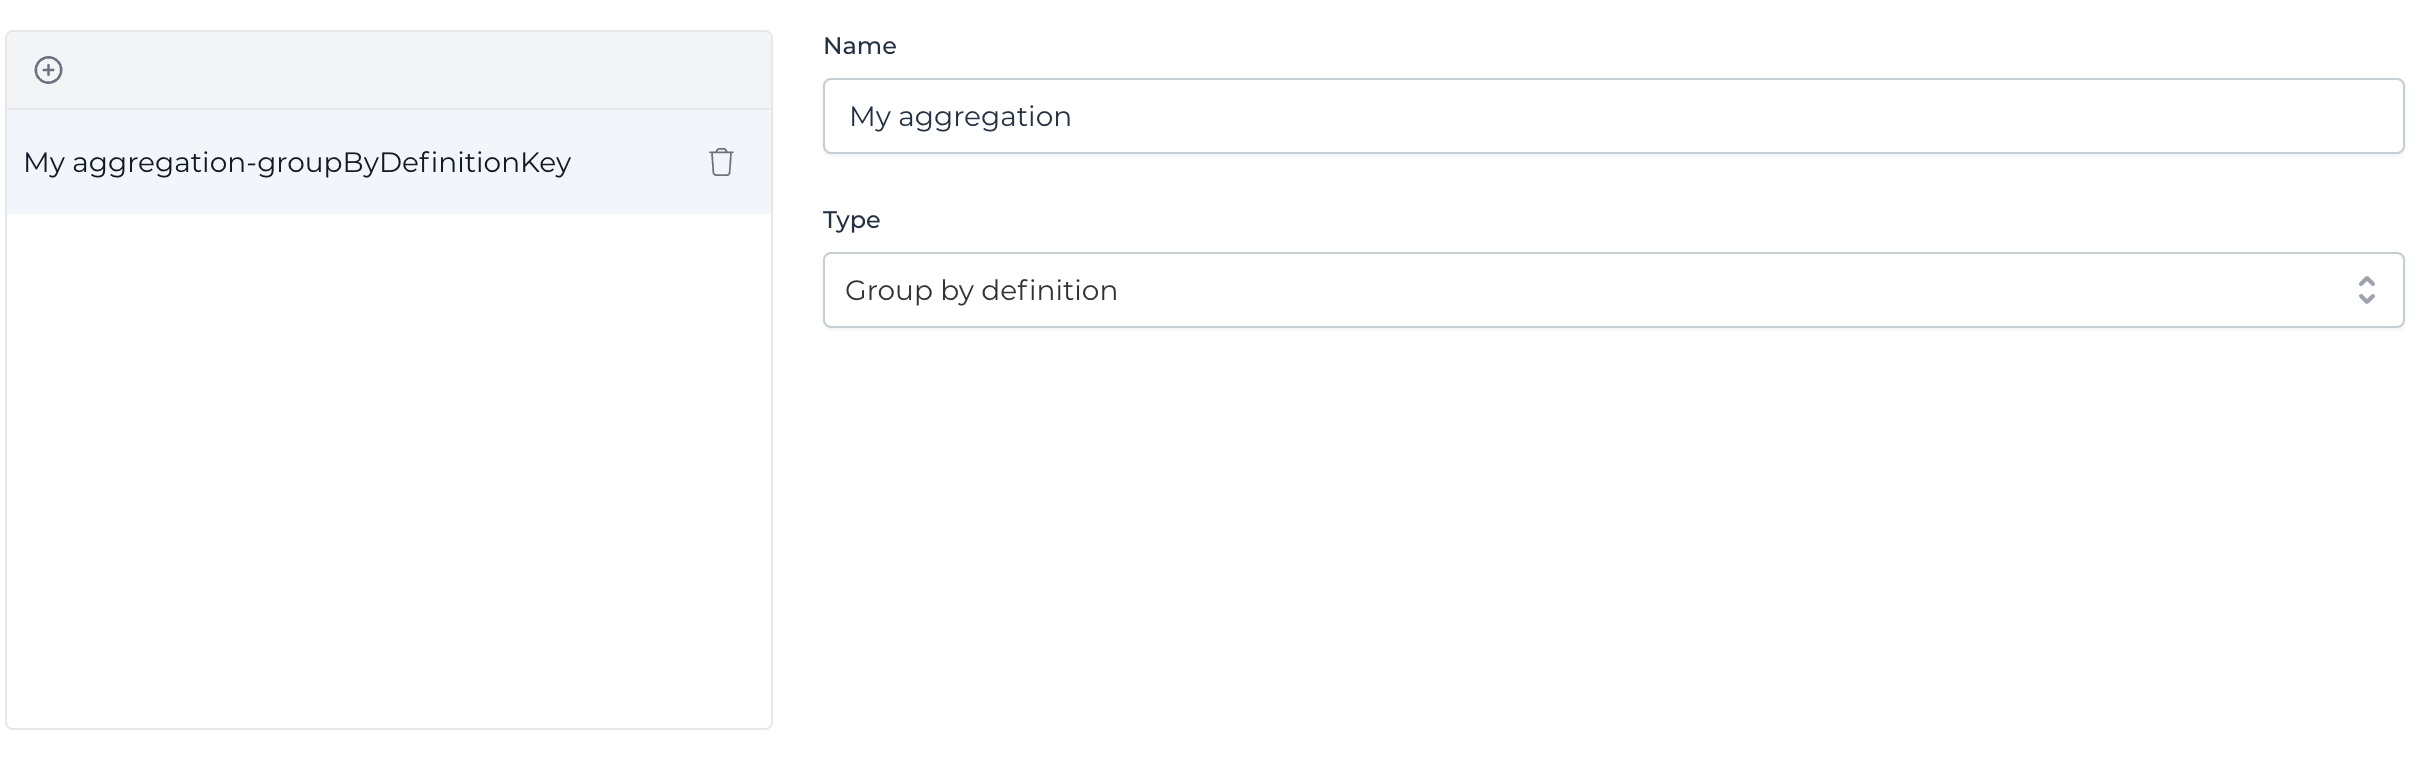
Aggregations
The last step of building a query is thinking about aggregations on top of the filtered data. Aggregations are the classic 'group by' to get insights into data.
Multiple aggregations can be defined on the same filtered data.
Each aggregation needs a name and a type, which will influence which dashboard component can use the query. For example, a pie chart could use a group by definition, but a single value component wouldn't.
These are the current aggregations possible:
- Count: this aggregation produces a single value by doing a count of the elements in dataset.
- Count completed/started/active: produces a single value that contains the count of the amount of completed, started or active elements.
- Group by definition: produces a list of key-values that groups the results by their definition and counts the amounts of elements for that definition. E.g. can be used to be a data source for a pie chart showing a distribution.
- Group by definition and state: similar to the previous one, but has two values for each definition: one count for the completed elements and one for the active ones. Can e.g. be used in a stacked bar chart.
- Group by date started/completed: produces a key-value list that is usable by a line chart dashboard component. The key is a timestamp, while the value is a count based on whether the element is started or completed.
- Max|Min|Average|Sum|Standard deviation of variable value: produces a single value for a numeric variable by executing the maximum, minimum, etc. operation on its values. Also needs the name of the variable which values should be used for this aggregation.
- Distribution of variable value: produces a key-value distribution (e.g. to be used in a pie chart) that, for each possible value of a text variable, counts how many variables with that value exist. Also needs the name of the variable which values should be used for this aggregation and a maximum size of distinct values. For example, when setting this to 10, at most 10 counts will be returned.
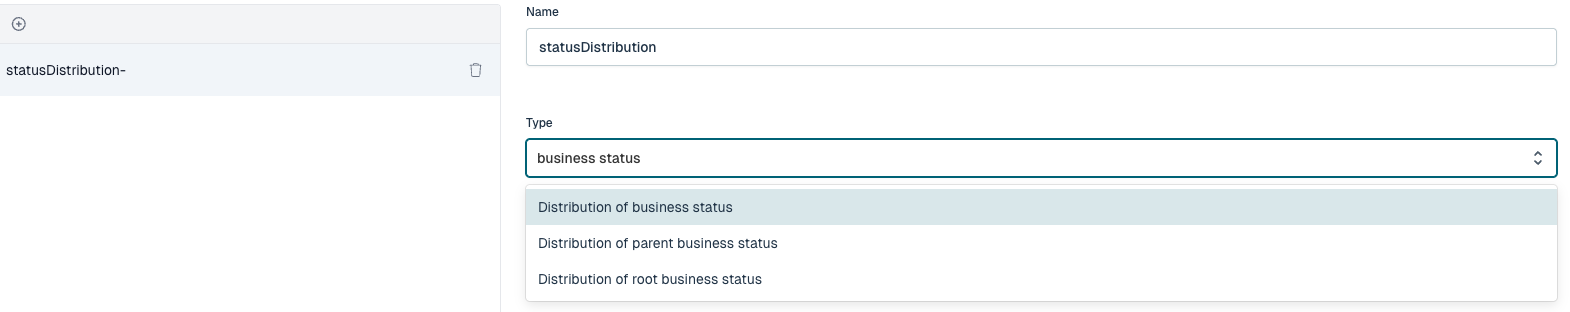
- Distribution of business status 2026.1.0+: produces a key-value distribution over the business status (e.g.
OPEN,IN_PROGRESS,CLOSED), counting how many elements have each status, ordered by occurrence count. Like the variable value distribution it takes a maximum size of distinct values (default 10) and can be used to drive a bar or pie chart. This aggregation is only available on the case instances, process instances and work source indexes. The Distribution of parent business status and Distribution of root business status variants apply the same aggregation to the parent and root scope respectively.