Flowable Control Installation Instructions
Prerequisites
See the Flowable System Requirements and Supported Software documentation.
Step-by-step Installation
License File
Flowable requires that you have a valid license for the Product.
The license is either stored on the file system or in the database.
If the license is provided as a file then it is
typically located in the .flowable folder of your home directory.
On Unix or macOS the file is ~/.flowable/flowable.license.
The location of the license file can be changed in the application.properties
file (see below).
flowable.control.app.license-location=file:/myCustomLocation/flowable.license
To store the license in the database then the following property must be set in
the applications.properties file:
flowable.control.app.db-store-enabled=true
With the license database store mode enabled a license is uploaded using the Flowable Control application.
WAR File
The Flowable Control WAR file can be either
- downloaded from the Flowable artifactory (com.flowable.control:flowable-control)
- built using the Flowable Control starter (please see here)
If you do not already have access to the Flowable Artifactory and the required dependencies, please contact your Flowable representative.
Copy the file into the Tomcat webapps folder.
Running Flowable Control in Tomcat
You can download Tomcat from here.
Once you download the package you should unpack it.
The Tomcat is started by running bin/catalina.sh (bin/catalina.bat on Windows).
Do not run Tomcat yet; first follow the steps for installing the Flowable WAR file.
Application Configuration File
Copy the file named application.properties into the Tomcat lib folder.
This file contains the most common configurations, such as the data source.
By default, an H2 database is created in the ~/flowable-db folder.
If you want to run with a different database, or use H2 in a different location, follow the instructions in the Using a Different Database section of this guide.
Furthermore, Flowable Work should be connected to the respective Flowable Engage or Flowable Work instance to perform actions over the REST-API.
For that the following properties can be set as part of the application.properties file:
flowable.control.app.cluster-config.type=work
flowable.control.app.cluster-config.name=Default Cluster
flowable.control.app.cluster-config.description=Default Flowable Cluster
flowable.control.app.cluster-config.server-address=http://localhost
flowable.control.app.cluster-config.port=8090
flowable.control.app.cluster-config.context-root=flowable-work
flowable.control.app.cluster-config.user-name=admin
flowable.control.app.cluster-config.password=<password>
flowable.control.app.cluster-config.authentication-type=basic
With these properties an initial cluster will be configured and will be used to communicate with the configured Flowable instance.
The properties will be applied only on initial bootup, i.e. when the database is empty. Afterwards you will need to manually configure this in the UI as explained in the Cluster Management User Documentation
The possible values for the flowable.control.app.cluster-config.type are described in the Enable Dashboards section of this guide.
OAuth2
The out-of-the-box Flowable Control Application comes with OAuth2 support.
There are different OAuth2 providers. Please refer to following guides for the configuration samples for Azure OAuth2 and Keycloak OAuth2.
Refresh Token
v3.16.6+When using OAuth2 the offline_access scope can be used for the client registration.
This will enable the Flowable Platform Application to refresh the access token when it expires.
e.g. when using oauth2CurrentUser to communication between Control and the Platform.
For this purpose there is also the property flowable.control.app.security.oauth2.authorized-client-repository-type with a default value of session.
With this the refresh token is stored in the HTTP session and can be used to refresh the access token when it expires.
If you are running a single node then this can be changed to default, which will use an in memory implementation.
Flowable Control Administration User
Out of the box Flowable Control creates one user with the username admin and password test.
The password can be customized (only during first startup of Flowable Control) by setting the following property.
flowable.control.app.user-store.password=<your custom password>
Starting Tomcat
You can now start Tomcat by running bin/catalina.sh (bin/catalina.bat on Windows).
Alternatively, you can run bin/catalina.sh run to have it in the foreground.
You should now be able to access the Flowable Control application:
You can log in with the user admin and password test. You need to login in every application as the Flowable applications use different user stores by default.
Using a Different Database
The Flowable applications are Spring Boot applications and are
configured in a standard Spring Boot way.
This means that the database can be configured by setting the
following properties to the application.properties file previously mentioned.
spring.datasource.url=<jdbc URL>
spring.datasource.driver-class-name=<jdbc driver class name>
spring.datasource.username=<username>
spring.datasource.password=<password>
The application.properties file contains examples for the compatible databases:
-
H2
-
MySQL
-
MariaDB v3.11.0+
-
PostgreSQL
-
Oracle
-
Microsoft SQL Server
-
DB2
The Flowable applications do not ship with the JDBC drivers for databases
other than H2. Therefore you need to download the appropriate JDBC driver
and copy the jar into the Tomcat lib folder.
The Flowable applications create the required database and tables when they start.
The database user (normally, flowable) needs database schema read-write permissions.
It is also possible to disable the schema creation or only perform schema validation.
For this the property flowable.control.app.database-schema-udpate needs to be set.
The possible values for it are:
true- Default value. A check is performed, and an update of the schema is performed if it is necessary.false- Checks the version of the DB schema against the library throws an exception if the versions don't match.ignore- Does nothing. No schema creation, no schema version check.
Dashboards
The dashboard functionality is available from version 3.8.0.
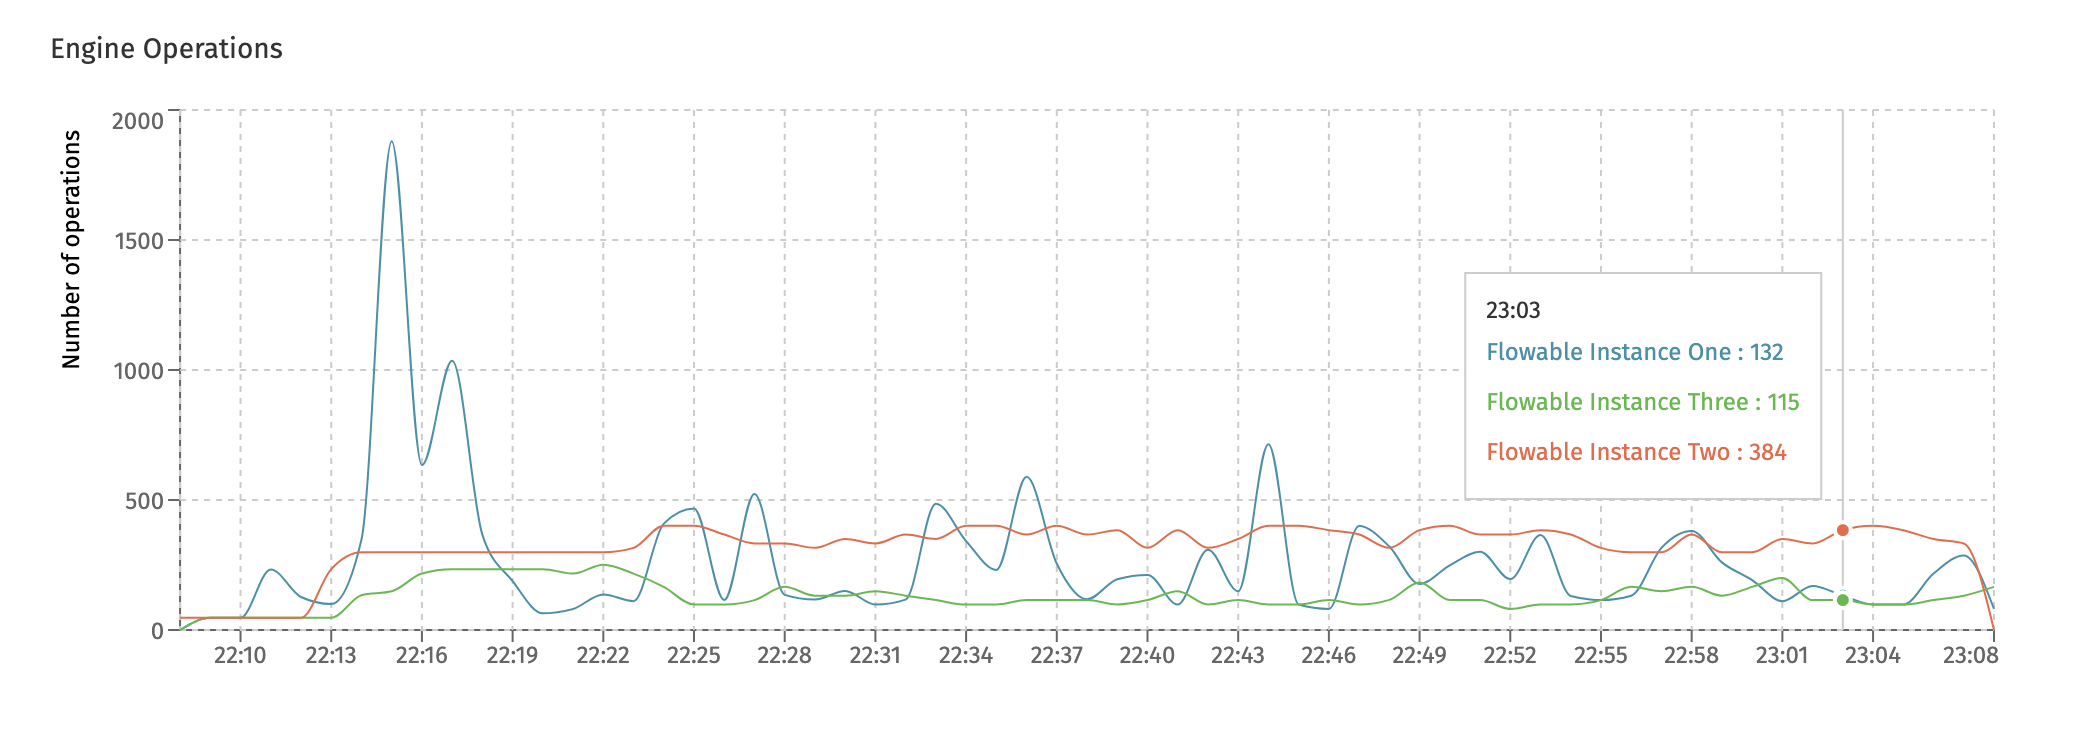
Flowable Control ships with a set of dashboards that give insight into instance data, system resources usage and general throughput metrics for the current cluster selected in the dropdown in the top-left corner. In this section, we'll focus on administration side of enabling and configuring the dashboards. To learn more about the kind of data displayed in the various charts and what the numbers mean, have a look at the User Guide documentation.
Generally speaking, the runtime systems (e.g. Flowable Work, Engage or a custom Flowable Orchestrate project) gather and publish metrics that are periodically published to Elasticsearch indices. Flowable uses the Micrometer framework under the covers to implement this.
There are three parts when it comes to enabling these dashboards:
- To gather and publish the data, one or more properties of the runtime systems need to be set. See the section on enabling metrics gathering for Flowable Work or Engage or enabling metrics gathering for Flowable Orchestrate for more information.
- Depending on your setup, the dashboards could be hidden by default.
- Flowable Control needs to be configured to a cluster that exposes the
Reporting REST API. This is the case when using the out of the box Flowable Work and Flowable Engage products. See enabling metrics gathering for Flowable Orchestrate how to enable it for Flowable Orchestrate.
Enable Metrics Gathering for Work or Engage
The dashboards display data that is gathered at runtime and published periodically to Elasticsearch.
To enable the publication of that data, the following property needs to be set to true.
management.metrics.elastic.export.enabled=true
No additional configuration is needed: the Elasticsearch settings (like host, port, etc.) of the general Work or Engage configuration will be used for publishing the metrics.
Similarly, if you want to disable gathering the metrics, this property needs to be set to false.
By default, the metrics will be gathered and pushed every minute to Elasticsearch. This frequency can be changed with the following property:
management.metrics.elastic.export.step=10m
In the above example, the frequency is changed to 10 minutes. This means that less data will be stored in the corresponding Elasticsearch index and thus the needed storage space requirements will be lower. Do note that the dashboard charts allow to zoom in to show metrics by each minute. Making the frequency slower than one minute, means that the per-minute data will not be exact anymore (but not wrong).
The metrics data is pushed to an index with a name that is prefixed with flowable-metrics (and additionally including any custom prefix configured in the general Elasticsearch settings).
By default, a new index is created every month. The dashboard queries take this into account and will query over all metrics indices.
To configure the suffix and separator, use the following properties (showing the default values):
management.metrics.elastic.export.index-date-format=yyyy-MM
management.metrics.elastic.export.index-date-separator=-
Note that changing the date format will also influence how many indices will be created. For example using yyyy as value will only create one index instead of twelve for each year.
Flowable does not automatically remove old indices. To manage the lifecycle of old indices please check out the metrics lifecycle how-to.
Enable Metrics Gathering for Flowable Orchestrate
The following is supported when using the Flowable Orchestrate Spring Boot starters only.
The dashboards display data that is gathered at runtime and published periodically to Elasticsearch.
Following dependencies need to be added to your project:
<dependency>
    <groupId>com.flowable.core</groupId>
    <artifactId>flowable-core-micrometer</artifactId>
    <version>${flowable.version}</version>
</dependency>
<dependency>
    <groupId>com.flowable.core</groupId>
    <artifactId>flowable-core-reporting-rest</artifactId>
    <version>${flowable.version}</version>
</dependency>
<dependency>
    <groupId>io.micrometer</groupId>
    <artifactId>micrometer-registry-elastic</artifactId>
</dependency>
The first and second dependency will pull in the Micrometer integration for Flowable and the REST API that Flowable Control uses when feching metrics for the dashboards. The last dependency pulls in the Elasticsearch binding for Micrometer.
This means that Flowable Orchestrate can sent its metrics to any Micrometer compatible solution. However, for the dashboards to work in Flowable Control, Elasticsearch is required.
Also note you need the spring-boot-starter-actuator dependency if you didn't add it yet. This is because the metrics feature is part of the Spring Boot Actuator component (see https://docs.spring.io/spring-boot/docs/current/reference/html/production-ready-features.html#production-ready-metrics):
<dependency>
    <groupId>org.springframework.boot</groupId>
    <artifactId>spring-boot-starter-actuator</artifactId>
</dependency>
To enable the publication of the data, the following properties needs to be set:
# Enables/disables the metrics gathering/publication
management.metrics.elastic.export.enabled=true

#The host and port for connecting to an Elasticsearch instance
management.metrics.elastic.export.host=http://localhost:9200

# The name of the index. This must be set to 'flowable-metrics', as that's what the queries from Control asssume.
management.metrics.elastic.export.index=flowable-metrics
By default, the metrics will be gathered and pushed every minute to Elasticsearch. This frequency can be changed with the following property:
management.metrics.elastic.export.step=10m
In the above example, the frequency is changed to 10 minutes. This means that less data will be stored in the corresponding Elasticsearch index and thus the needed storage space requirements will be lower. Do note that the dashboard charts allow to zoom in to show metrics by each minute. Making the frequency slower than one minute, means that the per-minute data will not be exact anymore (but not wrong).
By default, a new index is created every month. The dashboard queries take this into account and will query over all metrics indices.
To configure the suffix and separator, use the following properties (showing the default values):
management.metrics.elastic.export.index-date-format=yyyy-MM
management.metrics.elastic.export.index-date-separator=-
Note that changing the date format will also influence how many indices will be created. For example using yyyy as value will only create one index instead of twelve for each year.
Since this functionality uses the Spring Boot Micrometer integration, all properties possible there can be set against Flowable Orchestrate (see that documentation for more options and details). For example:
management.metrics.elastic.export.user-name=flowable
management.metrics.elastic.export.password=flowable
management.metrics.elastic.export.connect-timeout=1s
management.metrics.elastic.export.read-timeout=10s
Enable Dashboards
In some setups (e.g. using maven dependencies to build custom Flowable Orchestrate/Work/Engage projects), the dashboards are not shown by default.
The cluster type set in the configuration of Flowable Control will define which dashboards are displayed. Use the following property:
flowable.control.app.cluster-type=
Possible values are :
orchestrate: No dashboards are shown.orchestrate_metrics: Only dashboards for Flowable Orchestrate are shown (e.g. no instance nor active users dashboard).work: All dashboards are shown.engage: All dashboards are shown.
Changing The Node Name
When running with multiple nodes in a Flowable cluster, the metrics on the charts will by default use the hostname of the server where the software is running. This name is displayed on the charts when hovering over a specific datapoint.
If you want to give a custom name to each node, set the following property (e.g. in Flowable Orchestrate/Work/Engage):
flowable.node-name=custom
Disable Specific Metrics
It's possible to disable the gathering of specific metrics.
Note that these properties are set on the runtime side of things (e.g. Flowable Orchestrate/Work/Engage).
Use the following properties (the inline comments indicate the affected dashboards). All are enabled (true) by default.
# Captures 'engine operations' and 'job execution time' data.
flowable.metrics.command-enabled=true

# Captures 'async executor' data.
flowable.metrics.executor-enabled=true

# Captures 'job execution' and 'job failure' data.
flowable.metrics.job-enabled=true

# Captures 'event registry' data.
flowable.metrics.events-enabled=true
Backup Metrics Data
As metrics data, such as historical CPU or memory usage, is not crucial business information, such as process/case/task instance data, the data is only stored in an Elasticsearch index and not in the relational database. As such, when the Elasticsearch data is lost, there is no way to reindex the data (as is the case for the runtime data).
If you do need backups of this data, standard Elasticsearch backup methods can be used. See the documentation on Elasticsearch snapshots for more information.
Development Environment Setup
This section is relevant when you want to build your own version of Flowable Control, instead of using the out of the box application.
Flowable Control is based on Spring Boot and therefore requires the compatible version of it as a base for any development environment. The easiest way to setup a Flowable development project is to first generate a Spring Boot Project by using the Spring Initializr.
You can import the generated project into the IDE of your choice (like IntelliJ IDEA or Eclipse).
Flowable Control Dependencies
Flowable Control utilizes multiple Maven dependencies to access the required Flowable services.
Add the following dependencies as children of the existing <dependencies> tag of the pom.xml file to set up Flowable Control:
<dependency>
    <groupId>com.flowable.control</groupId>
    <artifactId>flowable-spring-boot-starter-control</artifactId>
    <version>${com.flowable.control.version}</version>
    <exclusions>
        <exclusion>
            <artifactId>spring-boot-starter-log4j2</artifactId>
            <groupId>org.springframework.boot</groupId>
        </exclusion>
    </exclusions>
</dependency>
The maven property com.flowable.control.version can be configured to the Flowable Control version (e. g. 3.x.y).
Flowable Control Properties
Depending on how the application you want to communicate to is configured you might need to set the following properties as well:
flowable.control.app.security.preemptive-basic-authentication=true
This would make sure that the authorization header with the credentials is sent as part of the initial request, instead of waiting for an HTTP Basic prompt.
When using Flowable Control with Flowable Work, and the default Security Configuration for Flowable Work, this should be set to true, otherwise you will get HTTP 401 when doing the requests.