Creating Dashboards with AI
Generative AI (as the name implies) is very apt when it comes to generating things based on natural language prompts.
One such place is the dashboard section in Flowable, shown here below.
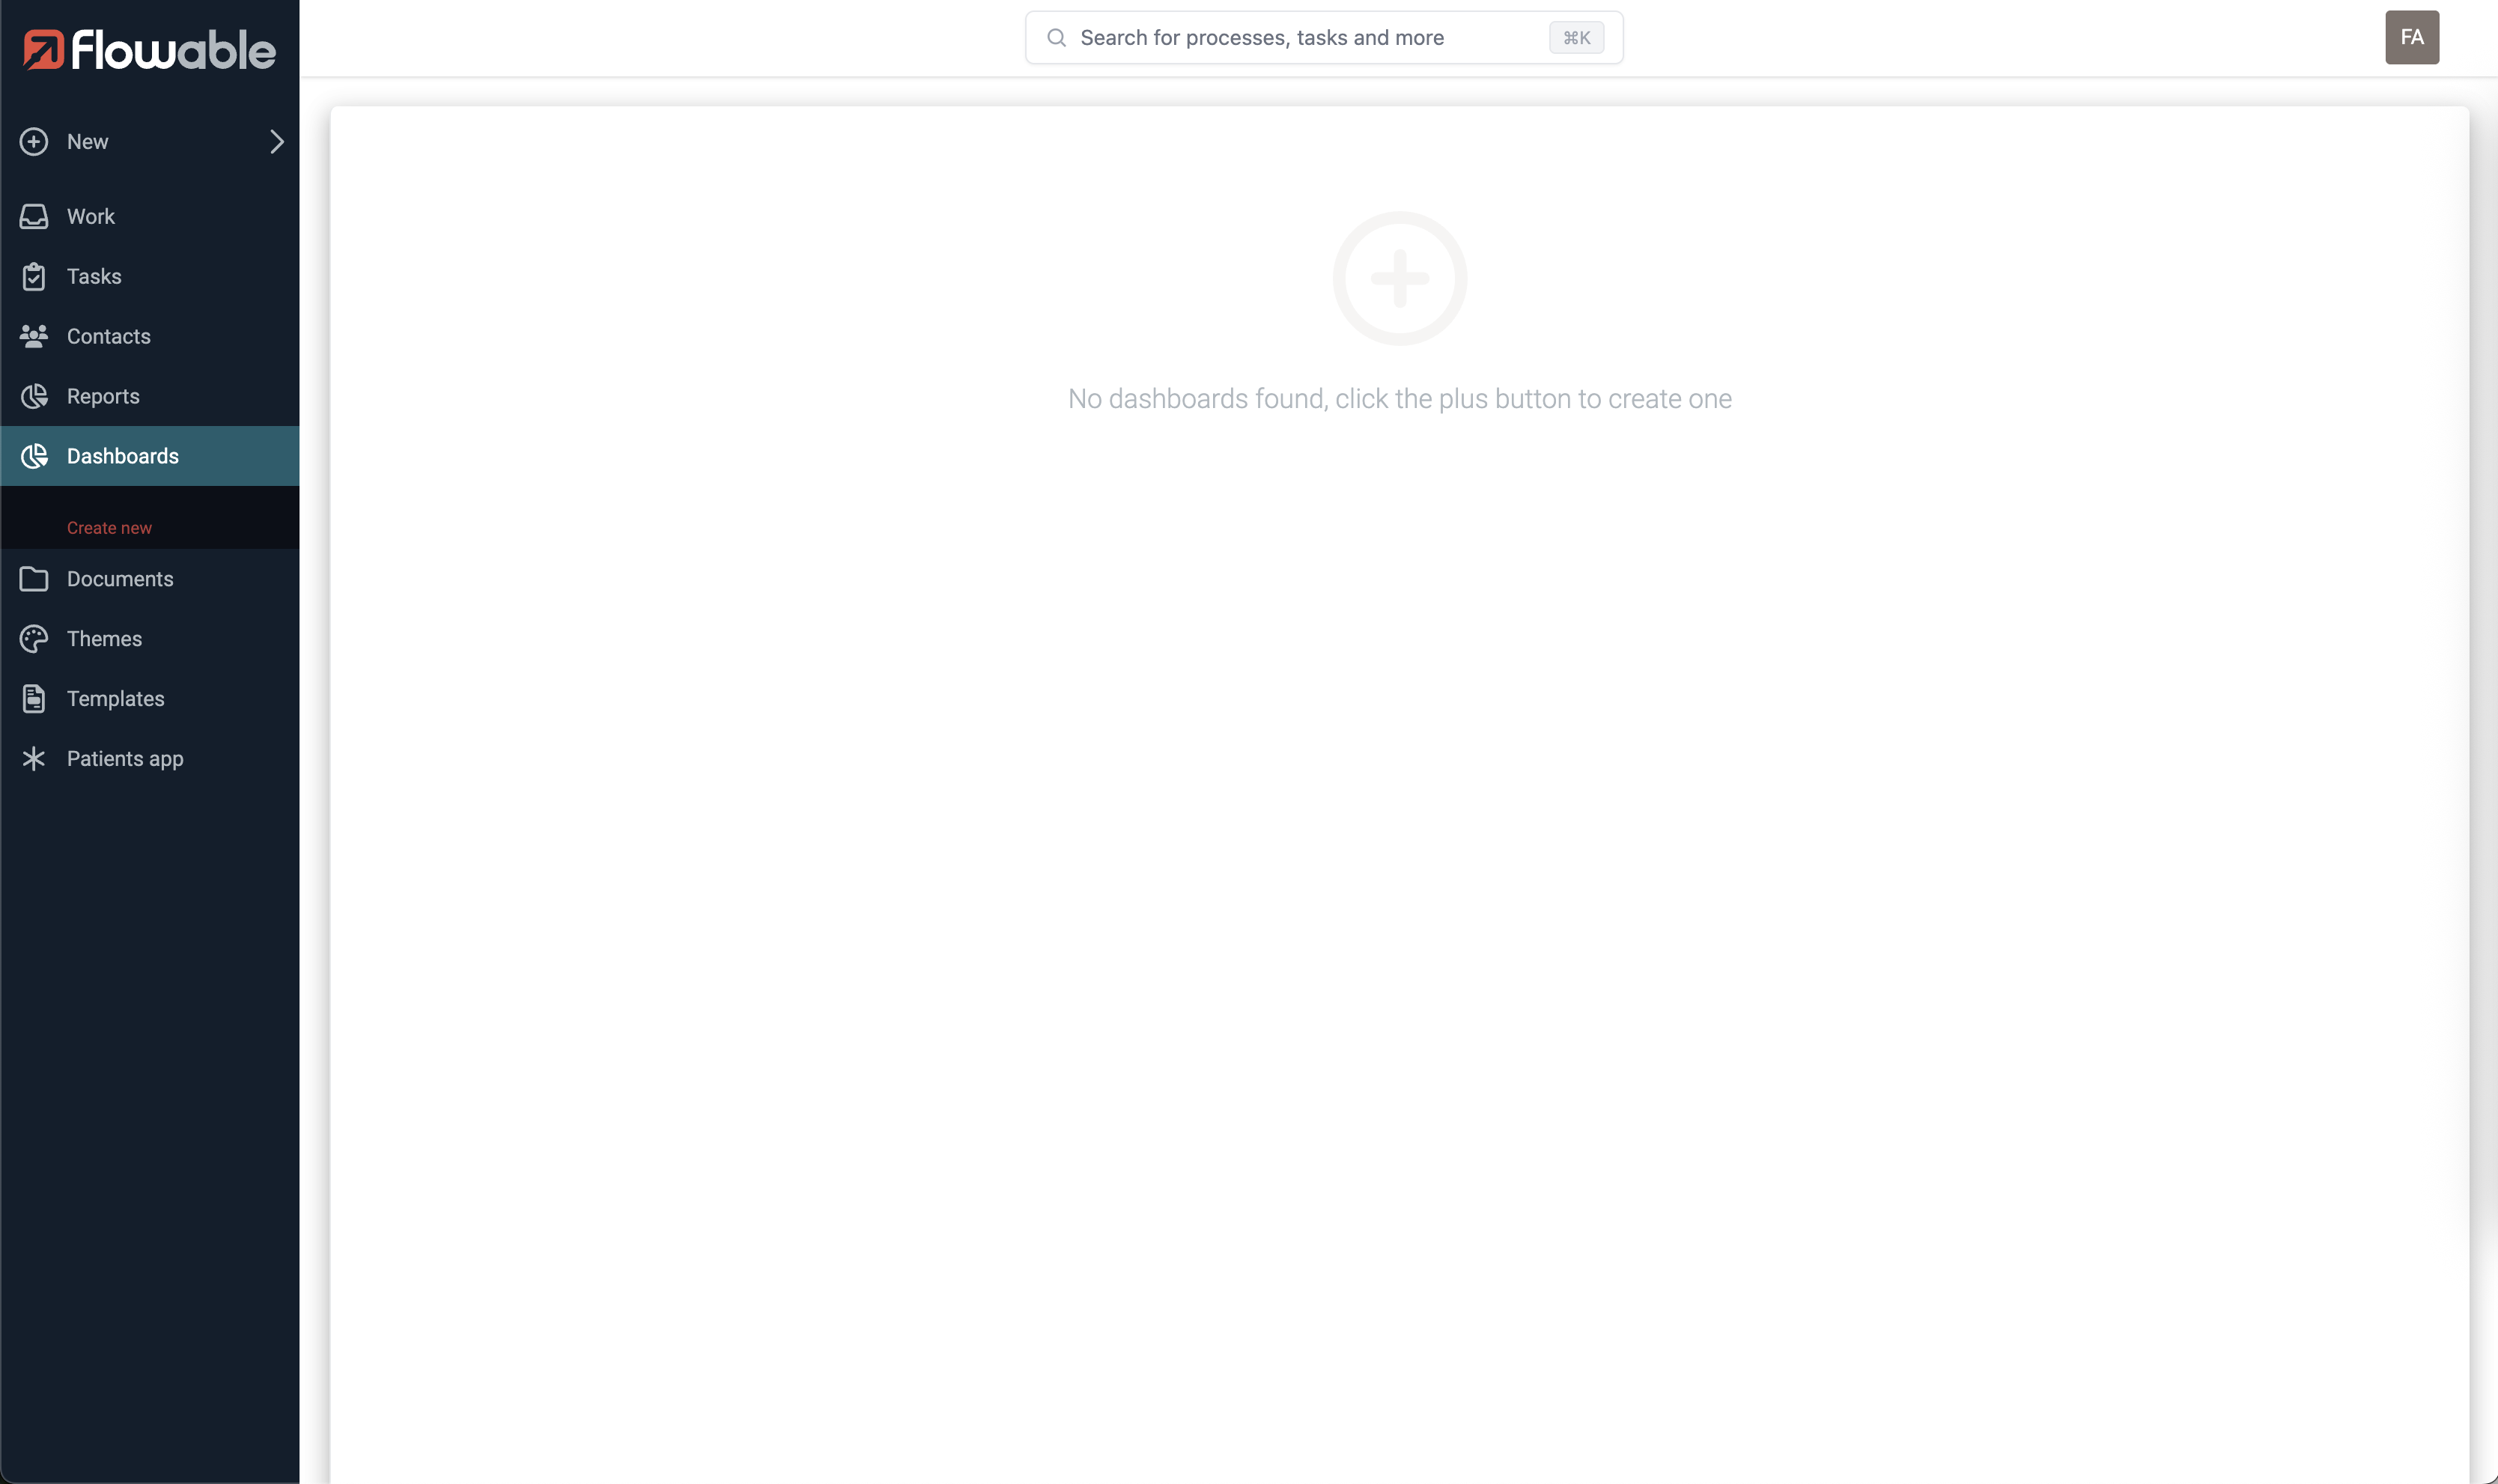
Clicking on Create new on the left-hand side or the large + icon on the screen shows a popup:
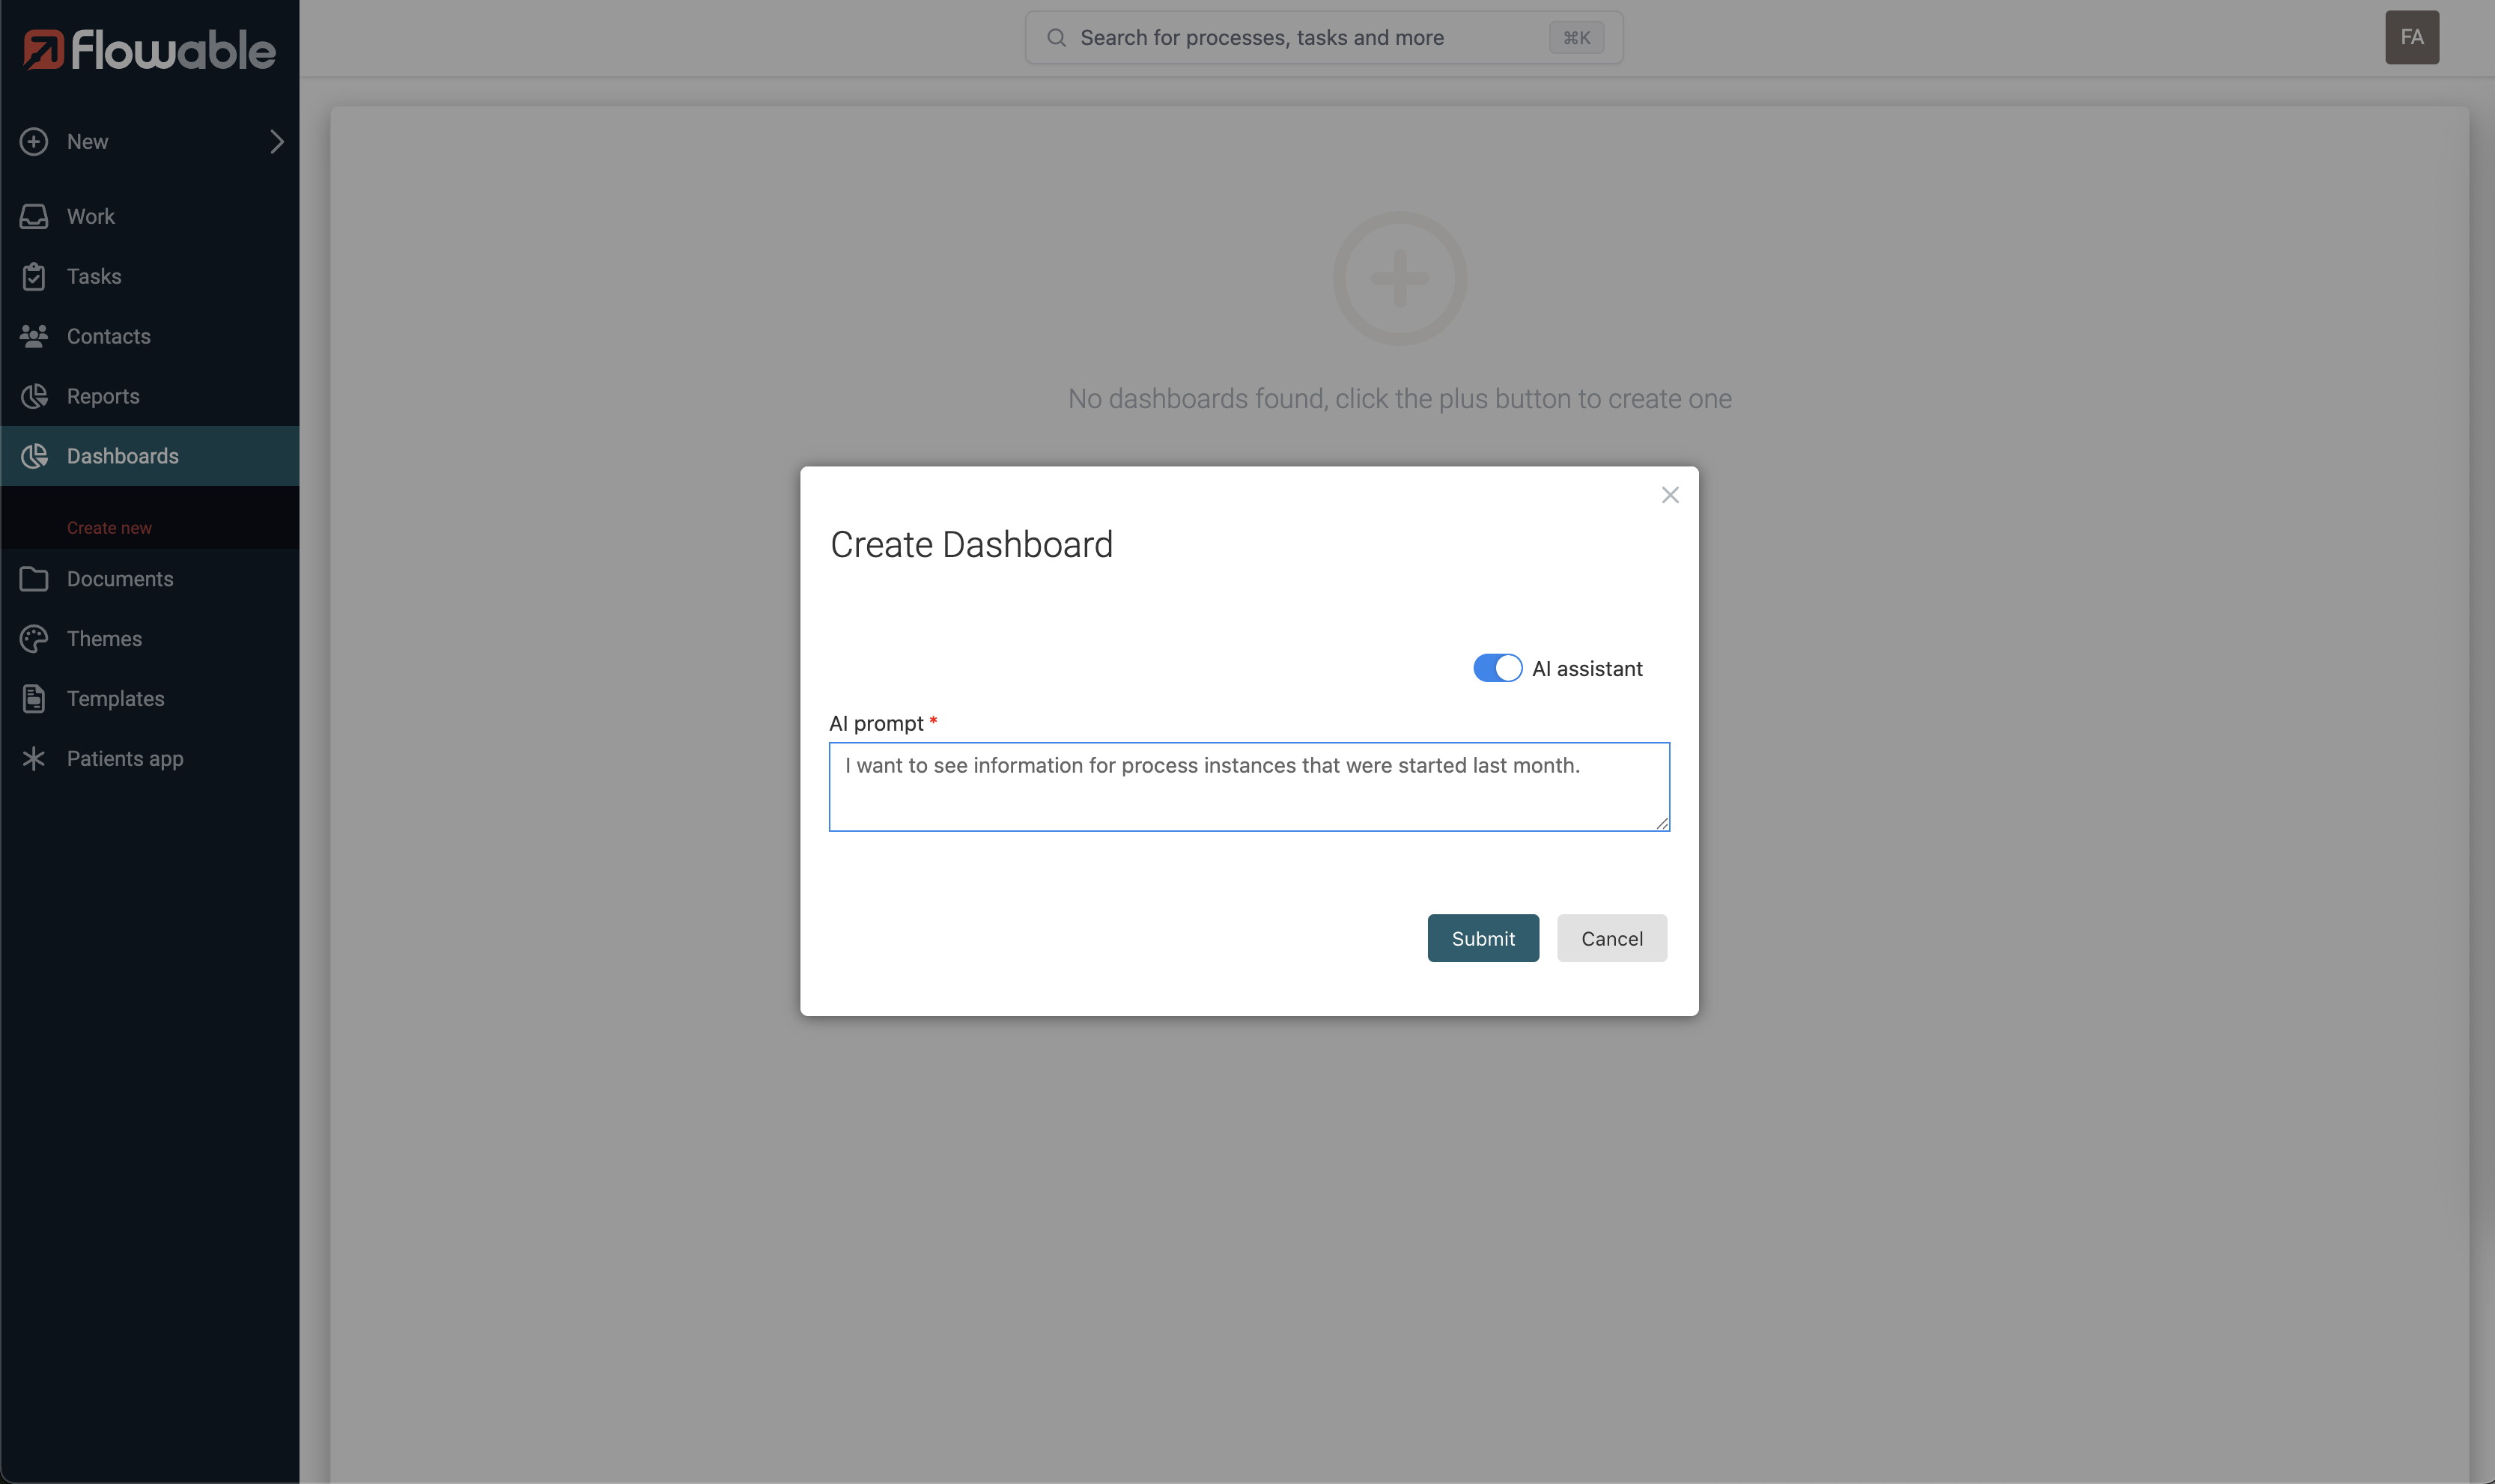
Normally one would fill in the name of the dashboard here. However, when selecting the AI assistant option, this field is replaced by a prompt text field. Fill in a prompt here what you'd like in the dashboard, e.g. I want to see information for process instances that were started last month.
Clicking submit will now process the prompt and generate the dashboard. It's a bit empty now, so let's click the Edit dashboard dropdown of the busson and select the Flowable assistant option. Clicking the button in the normal way would go into the normal dashboard edit mode.
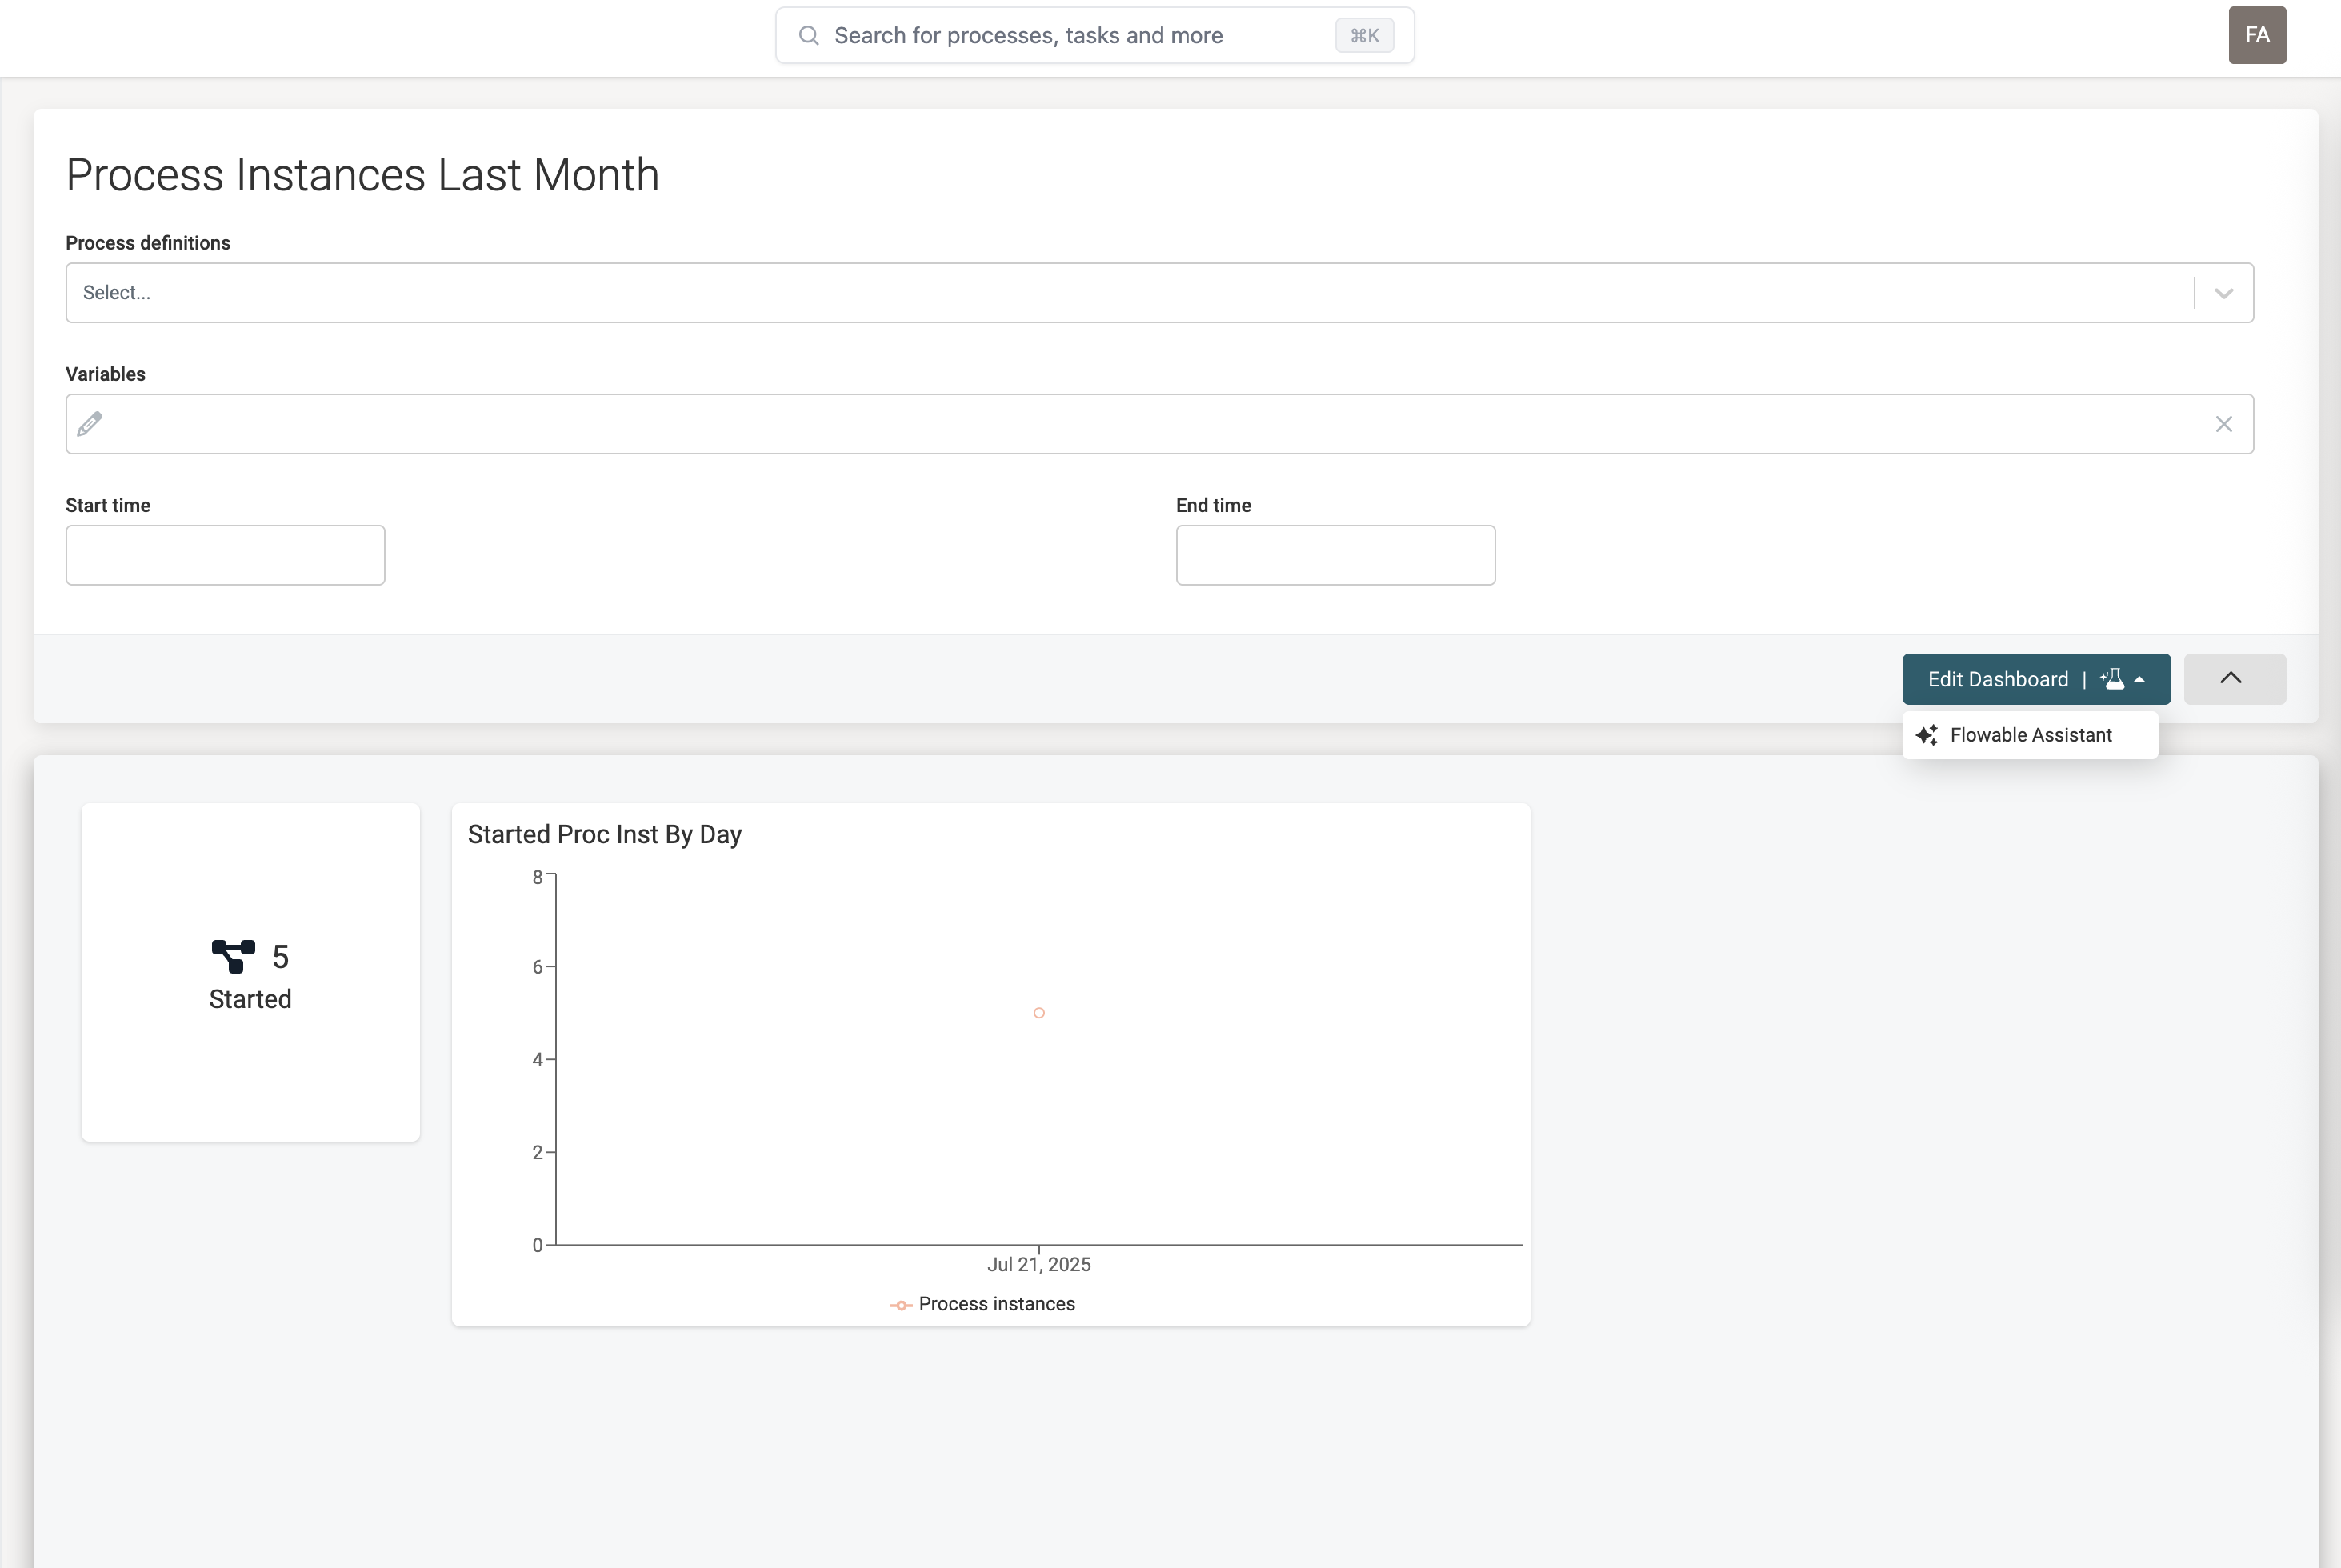
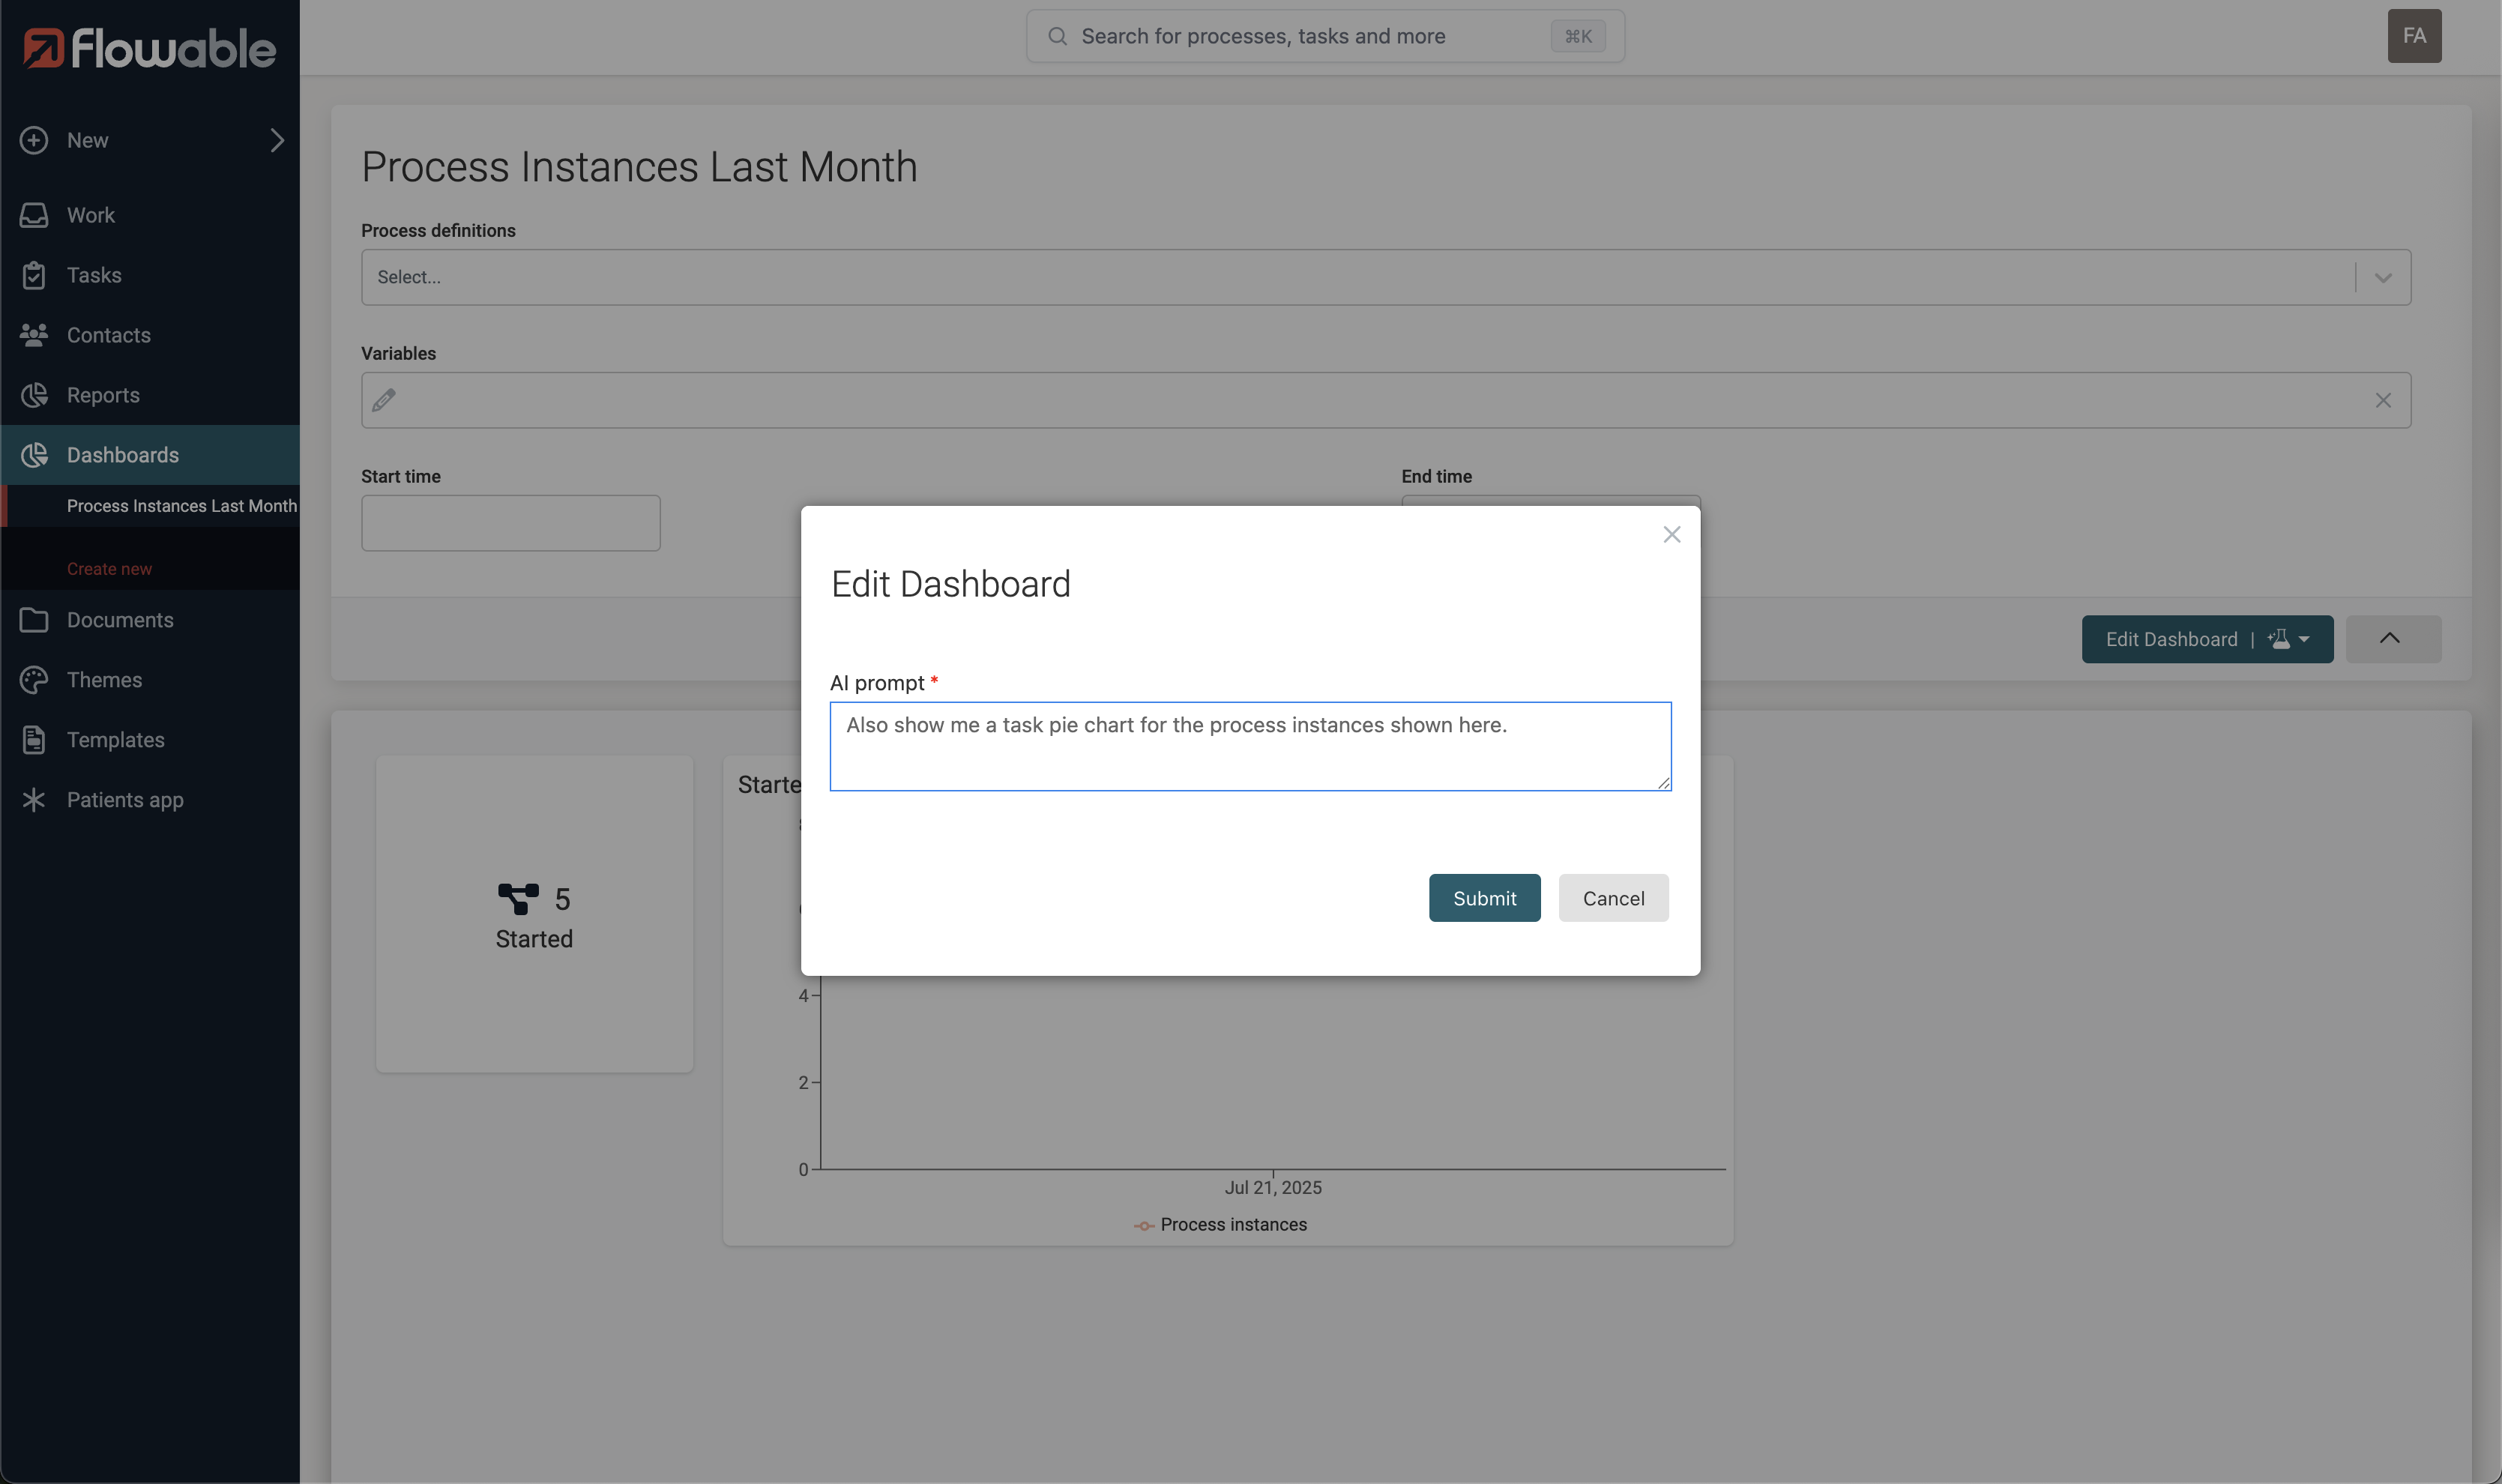
Let's say we also want to display tasks related to the process instances. We can do this by adding a prompt such as e.g. Also show me a task pie chart for the process instances shown here:
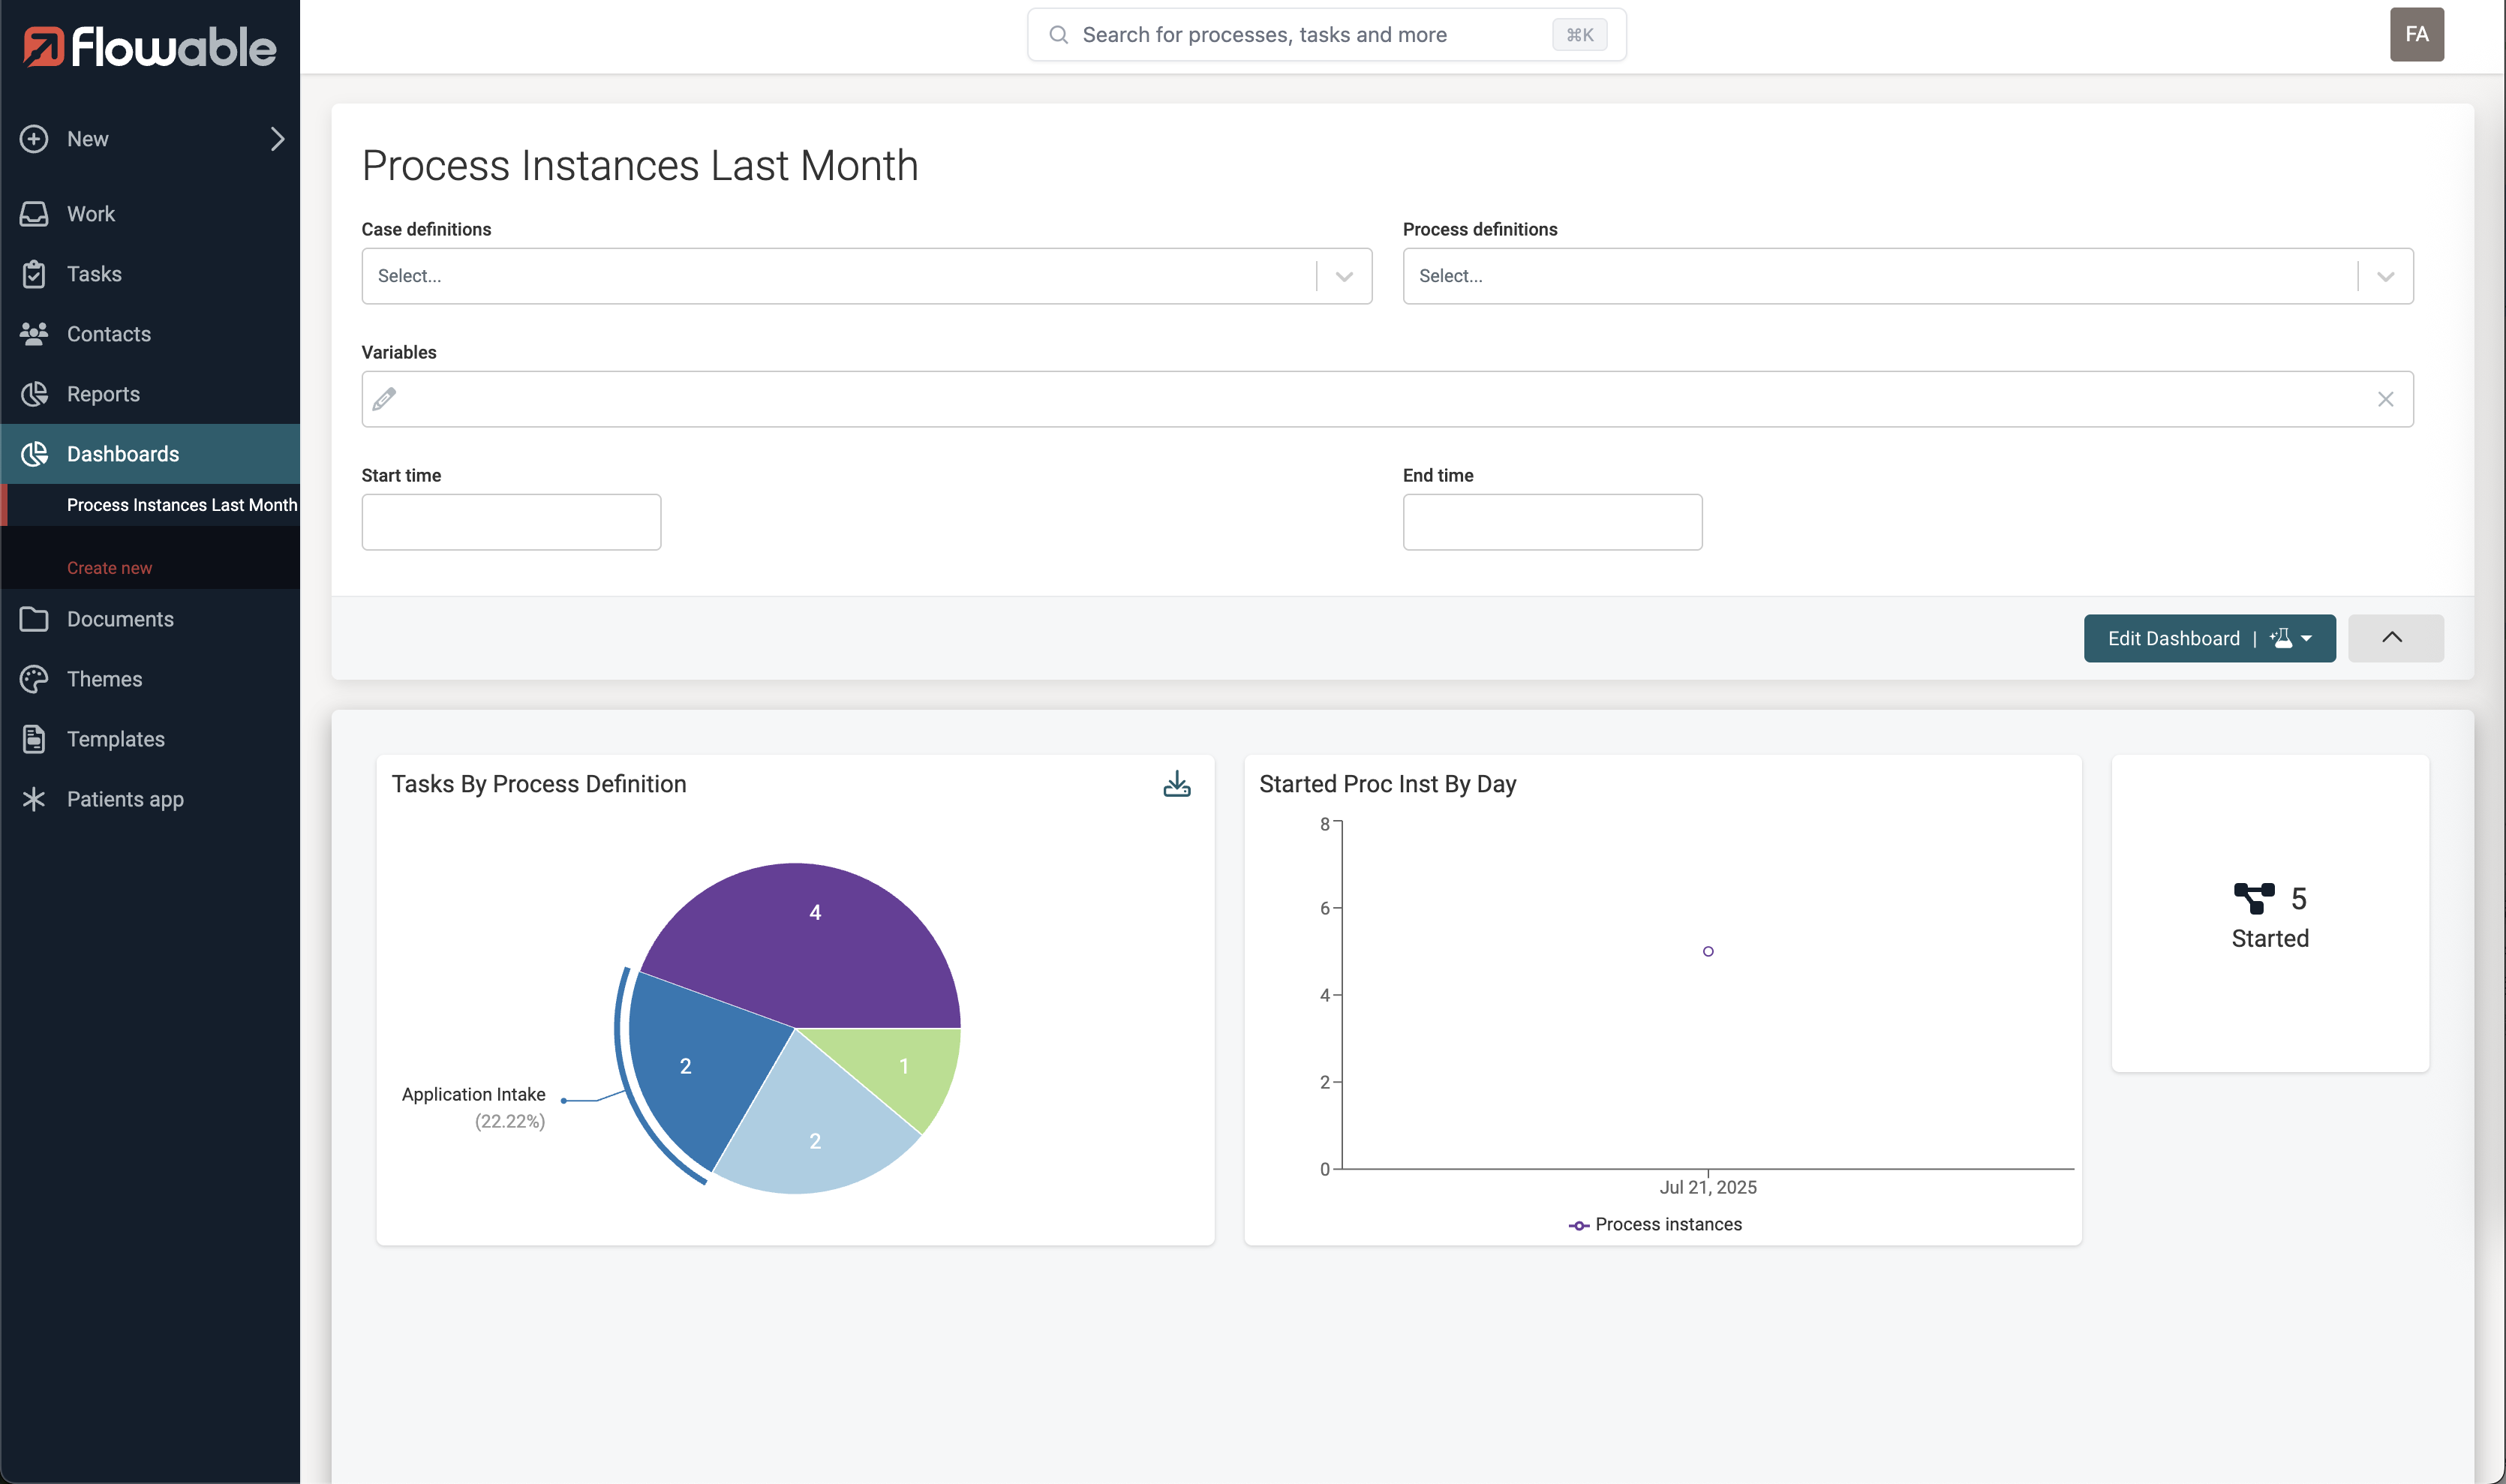
As shown below, asking for a "pie chart of tasks" will result in a dashboard containing exactly that, along with automatically generated component titles, layout, and even a suggested color scheme.
The generated dashboards are not static: they can be fully customized afterward to meet specific preferences or design standards. This includes adjusting chart types, labels, styling, or adding additional components.
This feature is designed to save time, especially in early stages of exploration or prototyping, by quickly turning a simple description into a working dashboard configuration.
